← Back to Work
AI Training Data Enterprise B2B Nymo.ai

The Pipeline That Had No Memory

Designing an auditable video transformation module for AI training data operations — and learning when a good hypothesis is still the wrong answer.

3 → 1
Tools replaced by one module
~60%
Less time on footage prep
<5 min
To trace a model error (was: half a day)
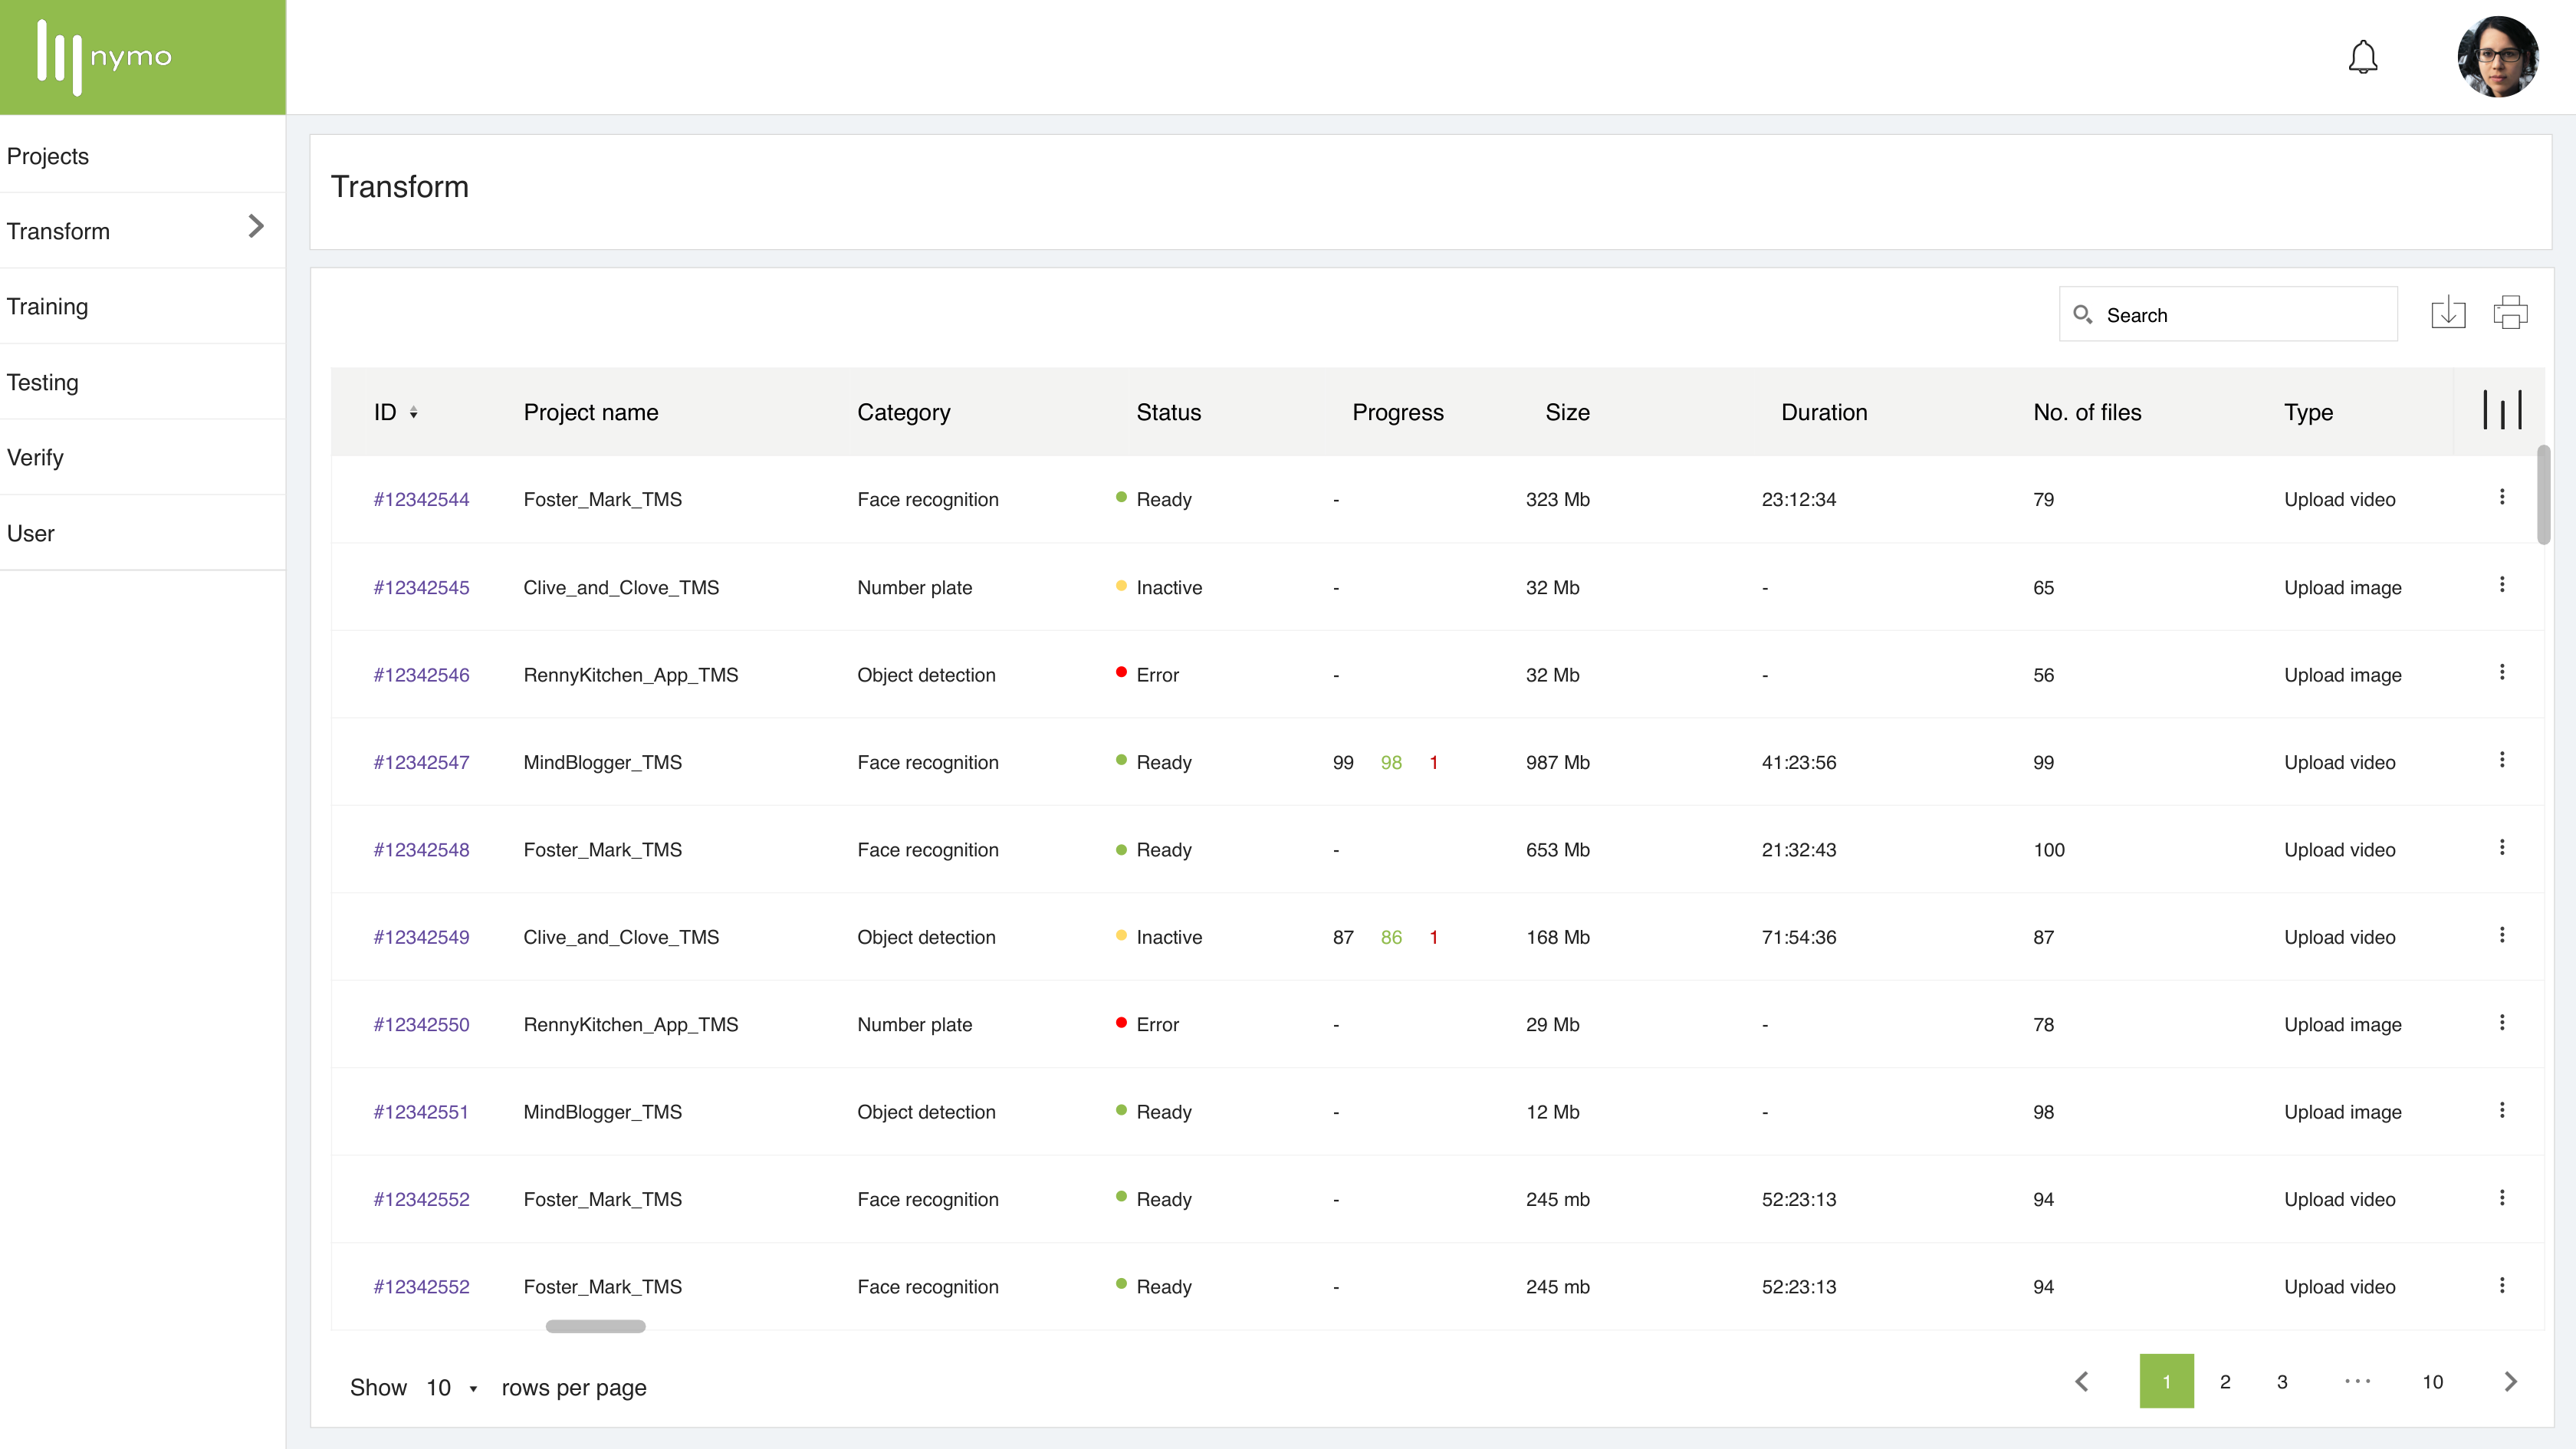
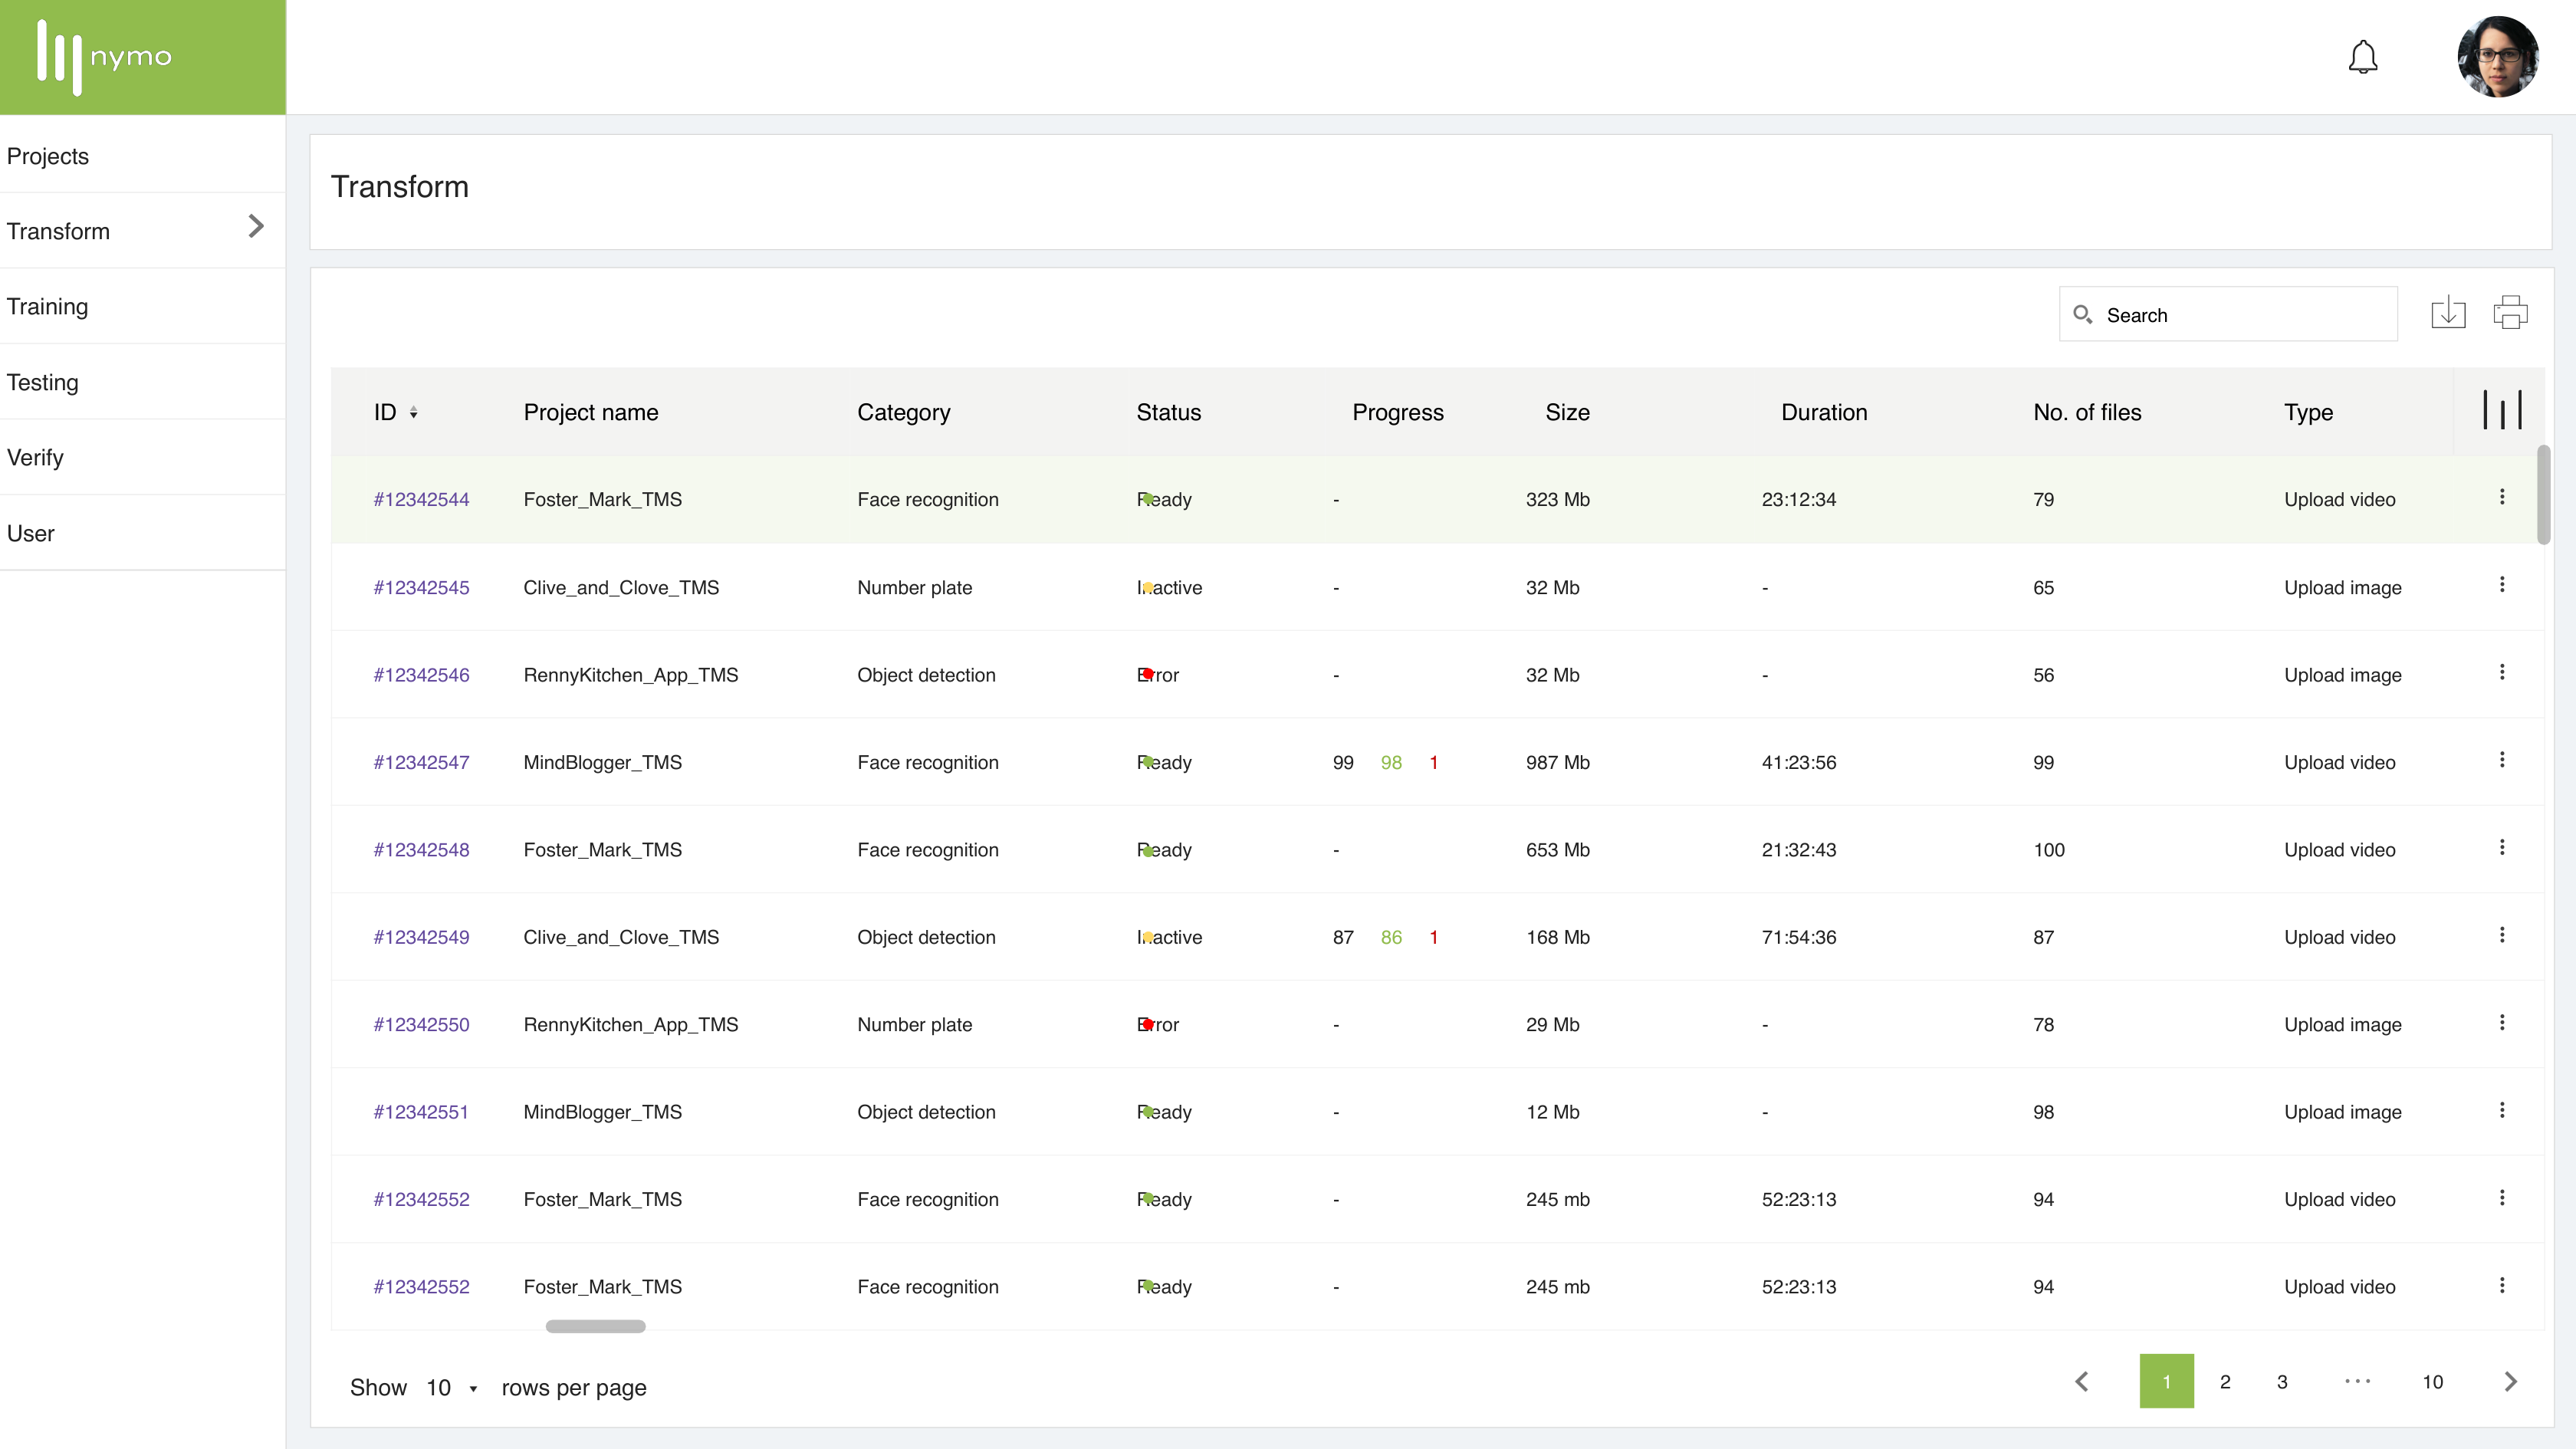
Nymo Transform project table showing active transformation projects with status indicators, progress counts, and file metadata
Case Study Summary
Problem

Video transformation pipeline relied on 3 separate tools, Slack threads, and zero audit trail.

Outcome

3→1 tools; ~60% less footage prep time; model errors traceable in <5 minutes.

My Role

UX Designer (fresher) — end-to-end design including a failed V1.

Key Learning

First principles beat convention. The V1 failure taught me more than the shipped design.

The Most Honest Thing I Can Say About V1

It was not bad thinking. It was untested thinking. That distinction is what this case study is about.

Nymo.ai runs AI models on live security camera footage — detecting faces, number plates, objects, and activity in real time. But a model is only as good as the data it trains on. And training data only becomes usable after it has been cleaned, formatted, and segmented. The Transform module is that preparation layer. It sits between raw footage ingestion and the annotation pipeline. Every video that trains a Nymo model passes through it.

Before this module existed, that work happened outside the platform — in personal software, on local machines, with no shared standards and no record of what anyone did.

UX Designer — research, IA, interaction design, prototype, handoff. Solo designer on this module. This was one of my earliest enterprise UX engagements — I was a fresher UX designer at the time, and the V1 failure was one of the most formative lessons in my career.

End-to-end module. Sprint 7, v0.7. Enterprise B2B — video analytics  /  AI training data operations. 8 research sessions across 3 user types. 2 rounds of usability testing.

Three Tools, No Standards, No Memory

Analysts were using a combination of VLC, FFmpeg via command line, and local video editors to prepare footage. The work got done — but the process had three structural failures that compounded over time.

No Traceability

Who did what, to which file, when — unknowable. Transformation history lived in Slack threads and personal folders.

No Consistency

Different resolution and fps across analysts. Downstream models trained on mismatched data without anyone realising.

No Visibility

Operations leads had no real-time project status. Checking progress meant messaging multiple analysts individually.

Silent Failures

FFmpeg errors produced no alerts. Analysts discovered failures only after annotation had already blocked — sometimes an hour of lost work later.

WHAT ANALYSTS WERE USING
VLC Basic format conversion
FFmpeg CLI Merging and splitting
Local editors Frame trimming
Slack messages Reporting status to leads

V1 — The Wizard That Made Sense Until Users Touched It

My initial design was a multi-step wizard. The hypothesis behind it was specific: data ops analysts who were less confident with technical parameters were making format errors because all choices were visible at once. A wizard that surfaced one decision at a time — files first, then format and quality, then confirm — would reduce those errors by narrowing focus at each step.

It was a reasonable hypothesis. It was wrong.

Why V1 Failed

Two rounds of testing. Three versions of the same problem. The feedback was consistent enough that I stopped mid-session two to discuss the architecture rather than the interaction.

"I need to be able to check what files are in the project while I'm setting the parameters. The wizard closes everything else. I kept going back and forth and losing my settings." — Data ops analyst, usability session 1
"I don't understand why the job status is in a different place from the project. I have to go to two places to understand what's happening to one thing." — Operations lead, usability session 1
"The wizard made me feel like I was doing one thing at a time. In reality I'm running three projects. I kept getting confused about which project I was transforming." — Data ops analyst, usability session 2

Three separate complaints. Same root cause: the wizard was built around a task-completion mental model. Analysts did not think of "run a transformation" as a discrete task to finish and move on from. They thought of it as a setting to apply to files inside a project they were already working in.

I scrapped the architecture entirely after session two. Not refined — scrapped.

Three Groups, Three Definitions of "Fixed"

I ran structured sessions with three user types. Each had a different relationship with the transformation workflow and a different definition of what success would look like.

Primary users
Data Ops Analysts
Ran the actual transformations — format conversion, merging, splitting across 30–50 files per day. Needed: batch operations without leaving project context, immediate error visibility, parallel work across multiple projects simultaneously. Did not need more powerful controls — they were asking to stop doing repetitive manual work.
Secondary users
Operations Leads
Managed 5–8 client projects simultaneously. Did not run transformations themselves. Needed: real-time project status from a single view. Did not need another tab or another place to check.
Downstream users
ML Engineers
Trained models on footage from the annotation pipeline. Did not use Transform directly. Needed: consistent output parameters and the ability to trace underperforming training data back to a specific transformation. Nothing else.

What the Research Actually Said

V1 failing wasn't a dead end — it was a signal. I went back to structured discovery: 3 contextual interviews (60 min) with analysts watching them work, 2 interviews (45 min) with operations leads, 2 sessions (30 min) with ML engineers downstream. Four findings shaped everything that followed.

The One Thing That Surprised Me

None of the analysts tracked the origin of any file they worked on. When I asked how they would trace a model failure back to source data, not one could answer. That single gap became the driving requirement for the Tree view.

"I download the file, run it through ffmpeg, re-upload it. I do this 30 or 40 times a day. If something goes wrong I find out when annotation fails — by then it's already cost me an hour." — Data ops analyst, discovery session 1

01 — Volume, Not Complexity

Analysts weren't asking for more powerful tools. Convert, merge, split are simple operations. The difficulty was performing them reliably at scale — hundreds of files, dozens of projects. In every session, every answer was a variation of: "less clicking, fewer steps."

02 — Errors Compound Silently

When a conversion failed, there was no alert. Analysts discovered failures downstream — in annotation or from a client complaint. Across all analyst sessions, every participant described discovering a failed conversion only after it had blocked something else.

03 — File Lineage Is Undervalued Until Missing

In 3 out of 3 analyst sessions, the question "if your model underperforms, how would you trace it back?" produced the same result: a pause of 10+ seconds, then "I honestly don't know." This was not a process gap — it was a missing mental model.

04 — Parallel Work Is Not an Edge Case

Analysts run transformations on multiple projects simultaneously. Any design that serialised their work — forcing one operation to complete before starting another — would be rejected immediately. In task-based testing, every analyst had at least two project tabs open before the session started.

One Insight That Changed the Architecture

The mental model was relational, not sequential. Analysts were not completing a task. They were managing a state — across multiple projects, multiple operations running simultaneously. A wizard serialised their work. It forced context-switching. It separated status from the project it belonged to.

Transformation is a tab inside a project, not a separate workflow.

Everything else followed from that.

The Fundamental Rule
Every transformation creates a child project.
Originals are never overwritten.
This single rule shapes the entire architecture. The Transform panel enforces it with a mandatory new project name field. The Tree view visualises the lineage it creates. The History log documents every branch.

Three Layers, Five Tabs, One Rule

Rather than separate screens for separate concerns, I built three nested layers: a project table for leads monitoring across projects, a five-tab project detail view for analysts working within a project, and an audit layer embedded inside each project rather than stored elsewhere.

The Project Table

Dense by design. Every project shows ID, name, category, status, progress, size, duration, and file count. No summaries, no abstractions. Leads need information density, not whitespace.

  • Three raw counts in colour — total / processed / errored. A percentage bar collapses the most critical information. 5 errors in a 10-file project is a crisis; 5 errors in a 1,000-file project is noise. Same percentage, completely different meaning.
  • Colour-coded text labels — status is readable without colour. Colour is reinforcement, not the only signal.
  • Audit fields hidden by default — Modified By and Modified On are there when needed, not cluttering daily operational views.
Project table showing ID, project name, category, status with coloured dots, three-number progress indicator, size, file count and type for each project

The Transform Panel

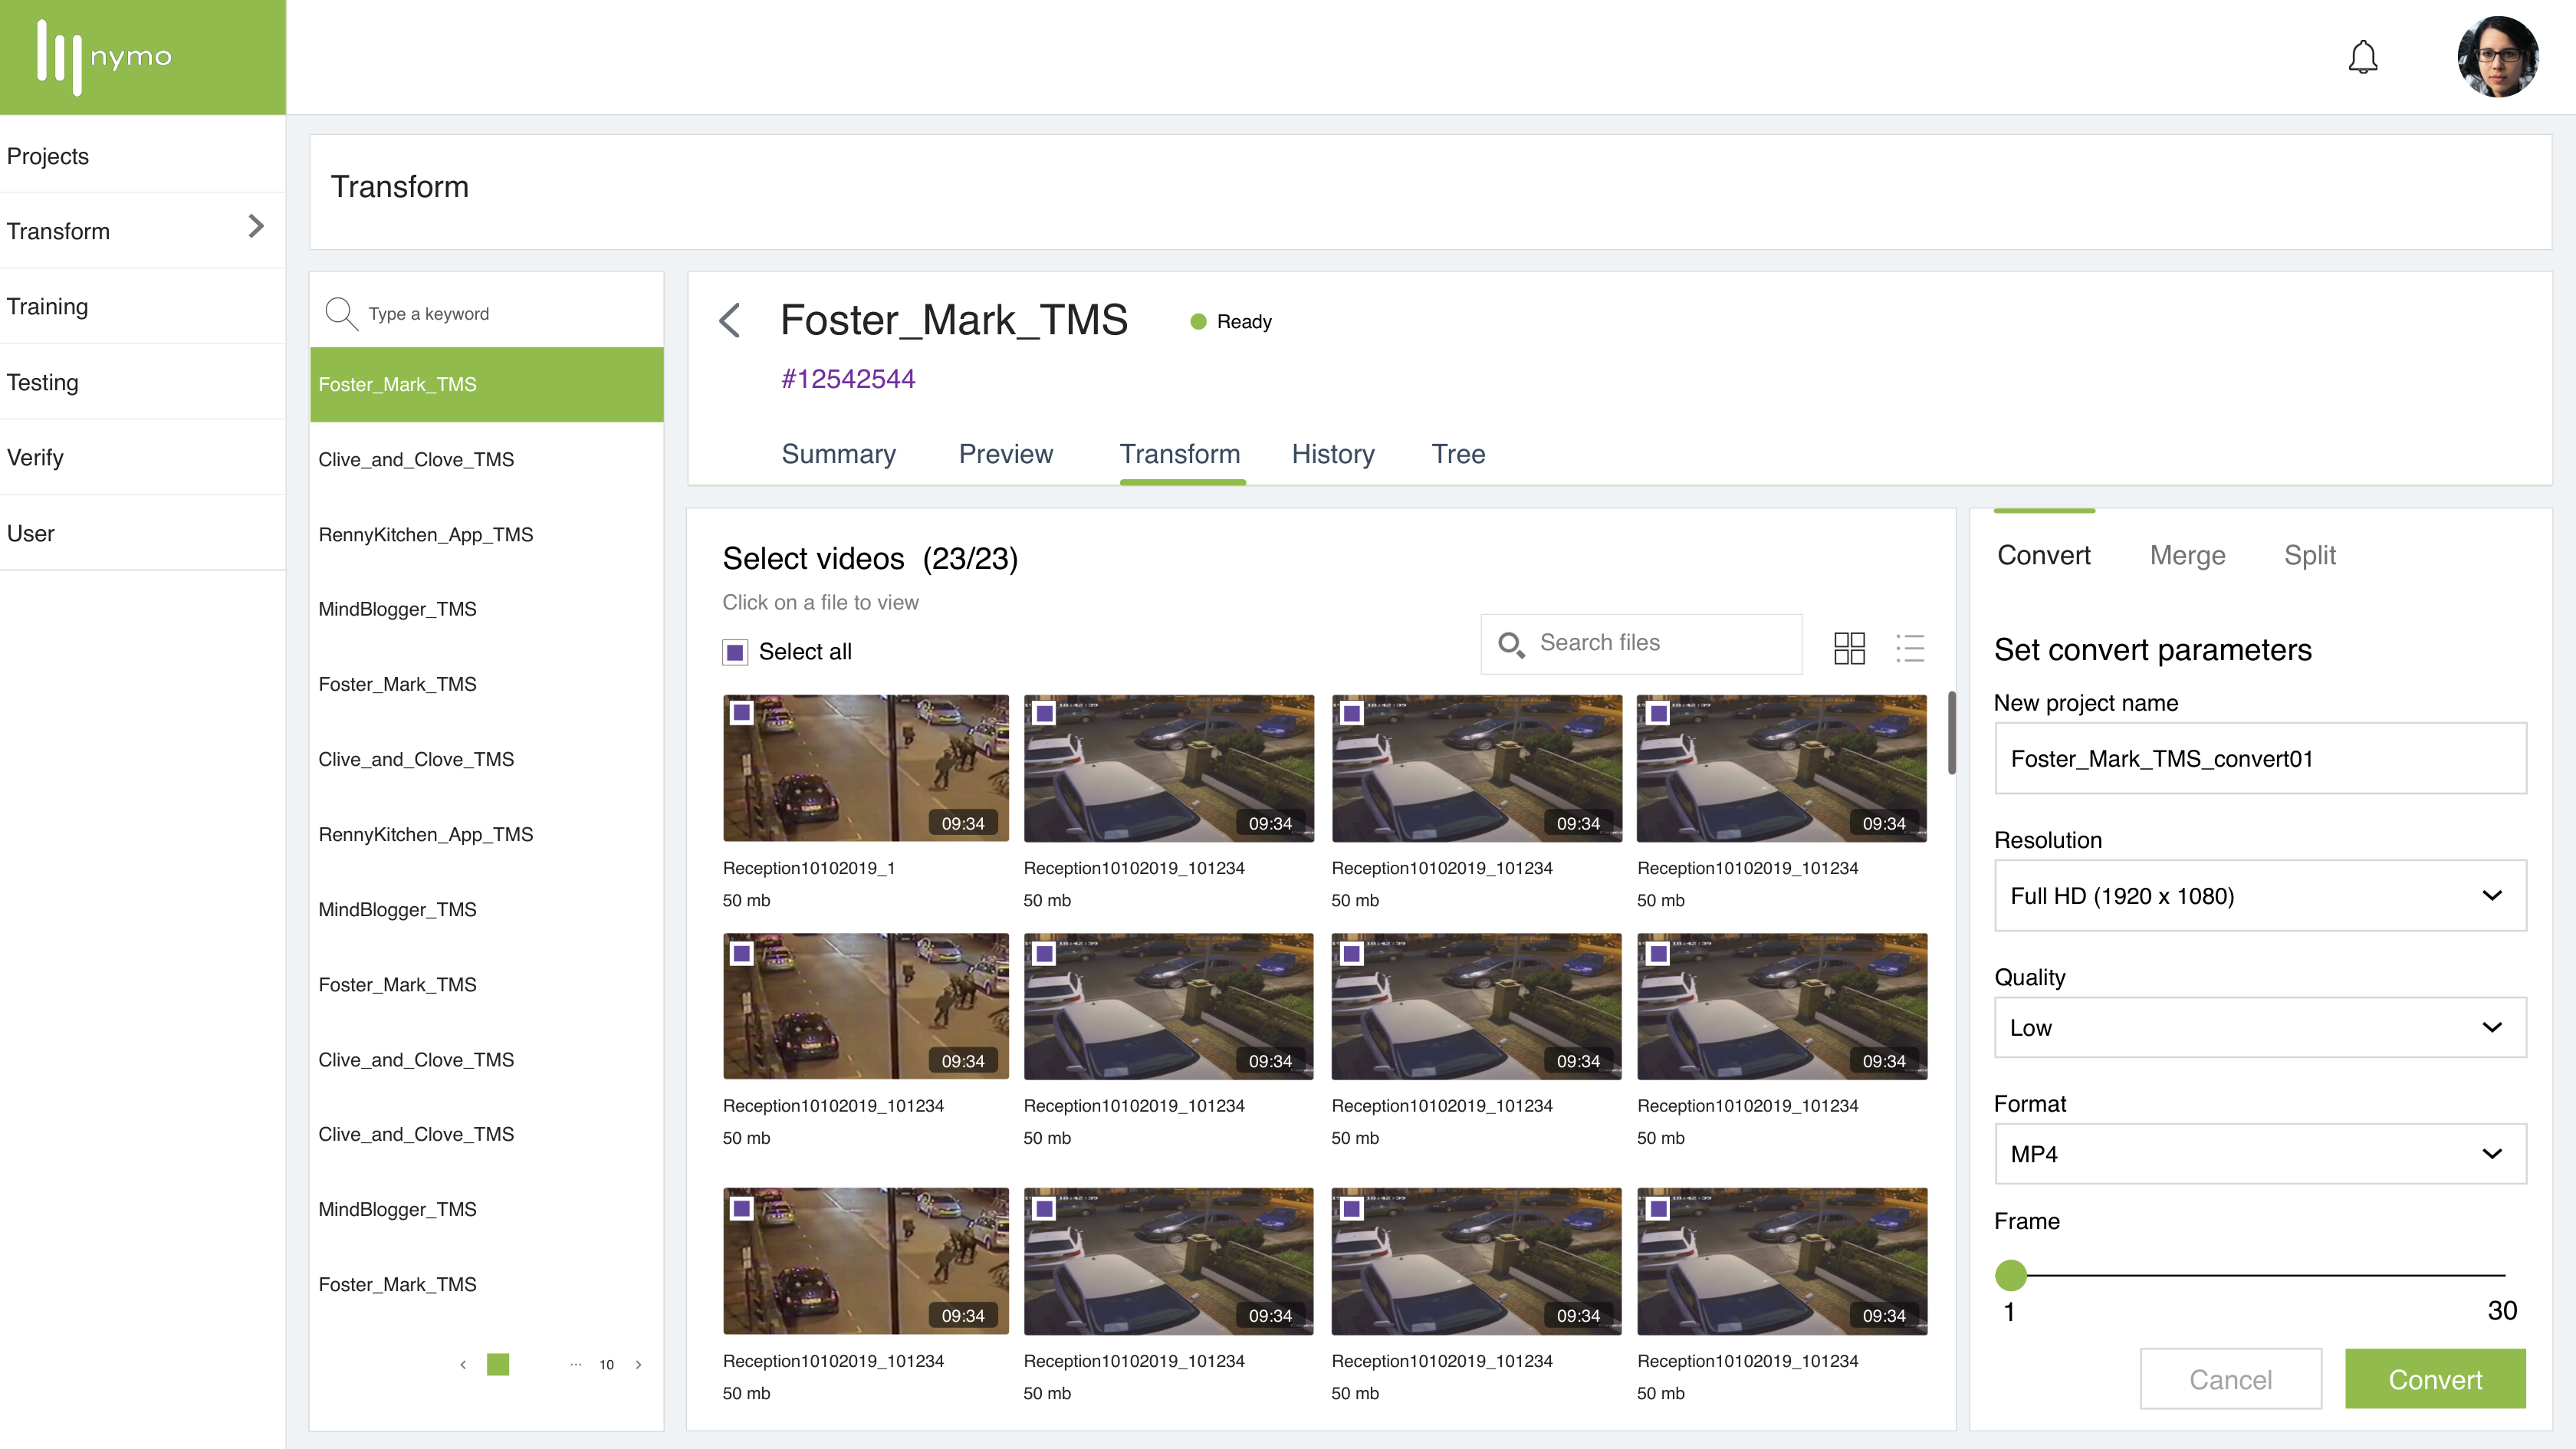
The Transform tab sits inside the project detail view. Left: file grid with thumbnails and duration overlays. Right: parameter panel with Convert, Merge, and Split tabs.

  • Every transformation creates a child project. Originals are never overwritten. This is a fundamental rule from research — no destructive operations. The UI makes it non-negotiable via a mandatory "new project name" field.
  • Inline preview panel — file metadata (resolution, fps, duration) opens alongside the grid without interrupting parameter-setting state.
  • Convert, Merge, Split — resolution SD through 4K, quality Low / Medium / High, format MP4 / WEBM, frame rate slider 1–30. Merge shows total duration as a calculated read-only field. Split offers two methods: by duration (slider) and by timestamp (dual handles).
Transform panel with video thumbnail grid on the left and Convert parameters on the right — new project name field, resolution dropdown, quality, format, and frame rate slider

Async Operations & Real-Time Status

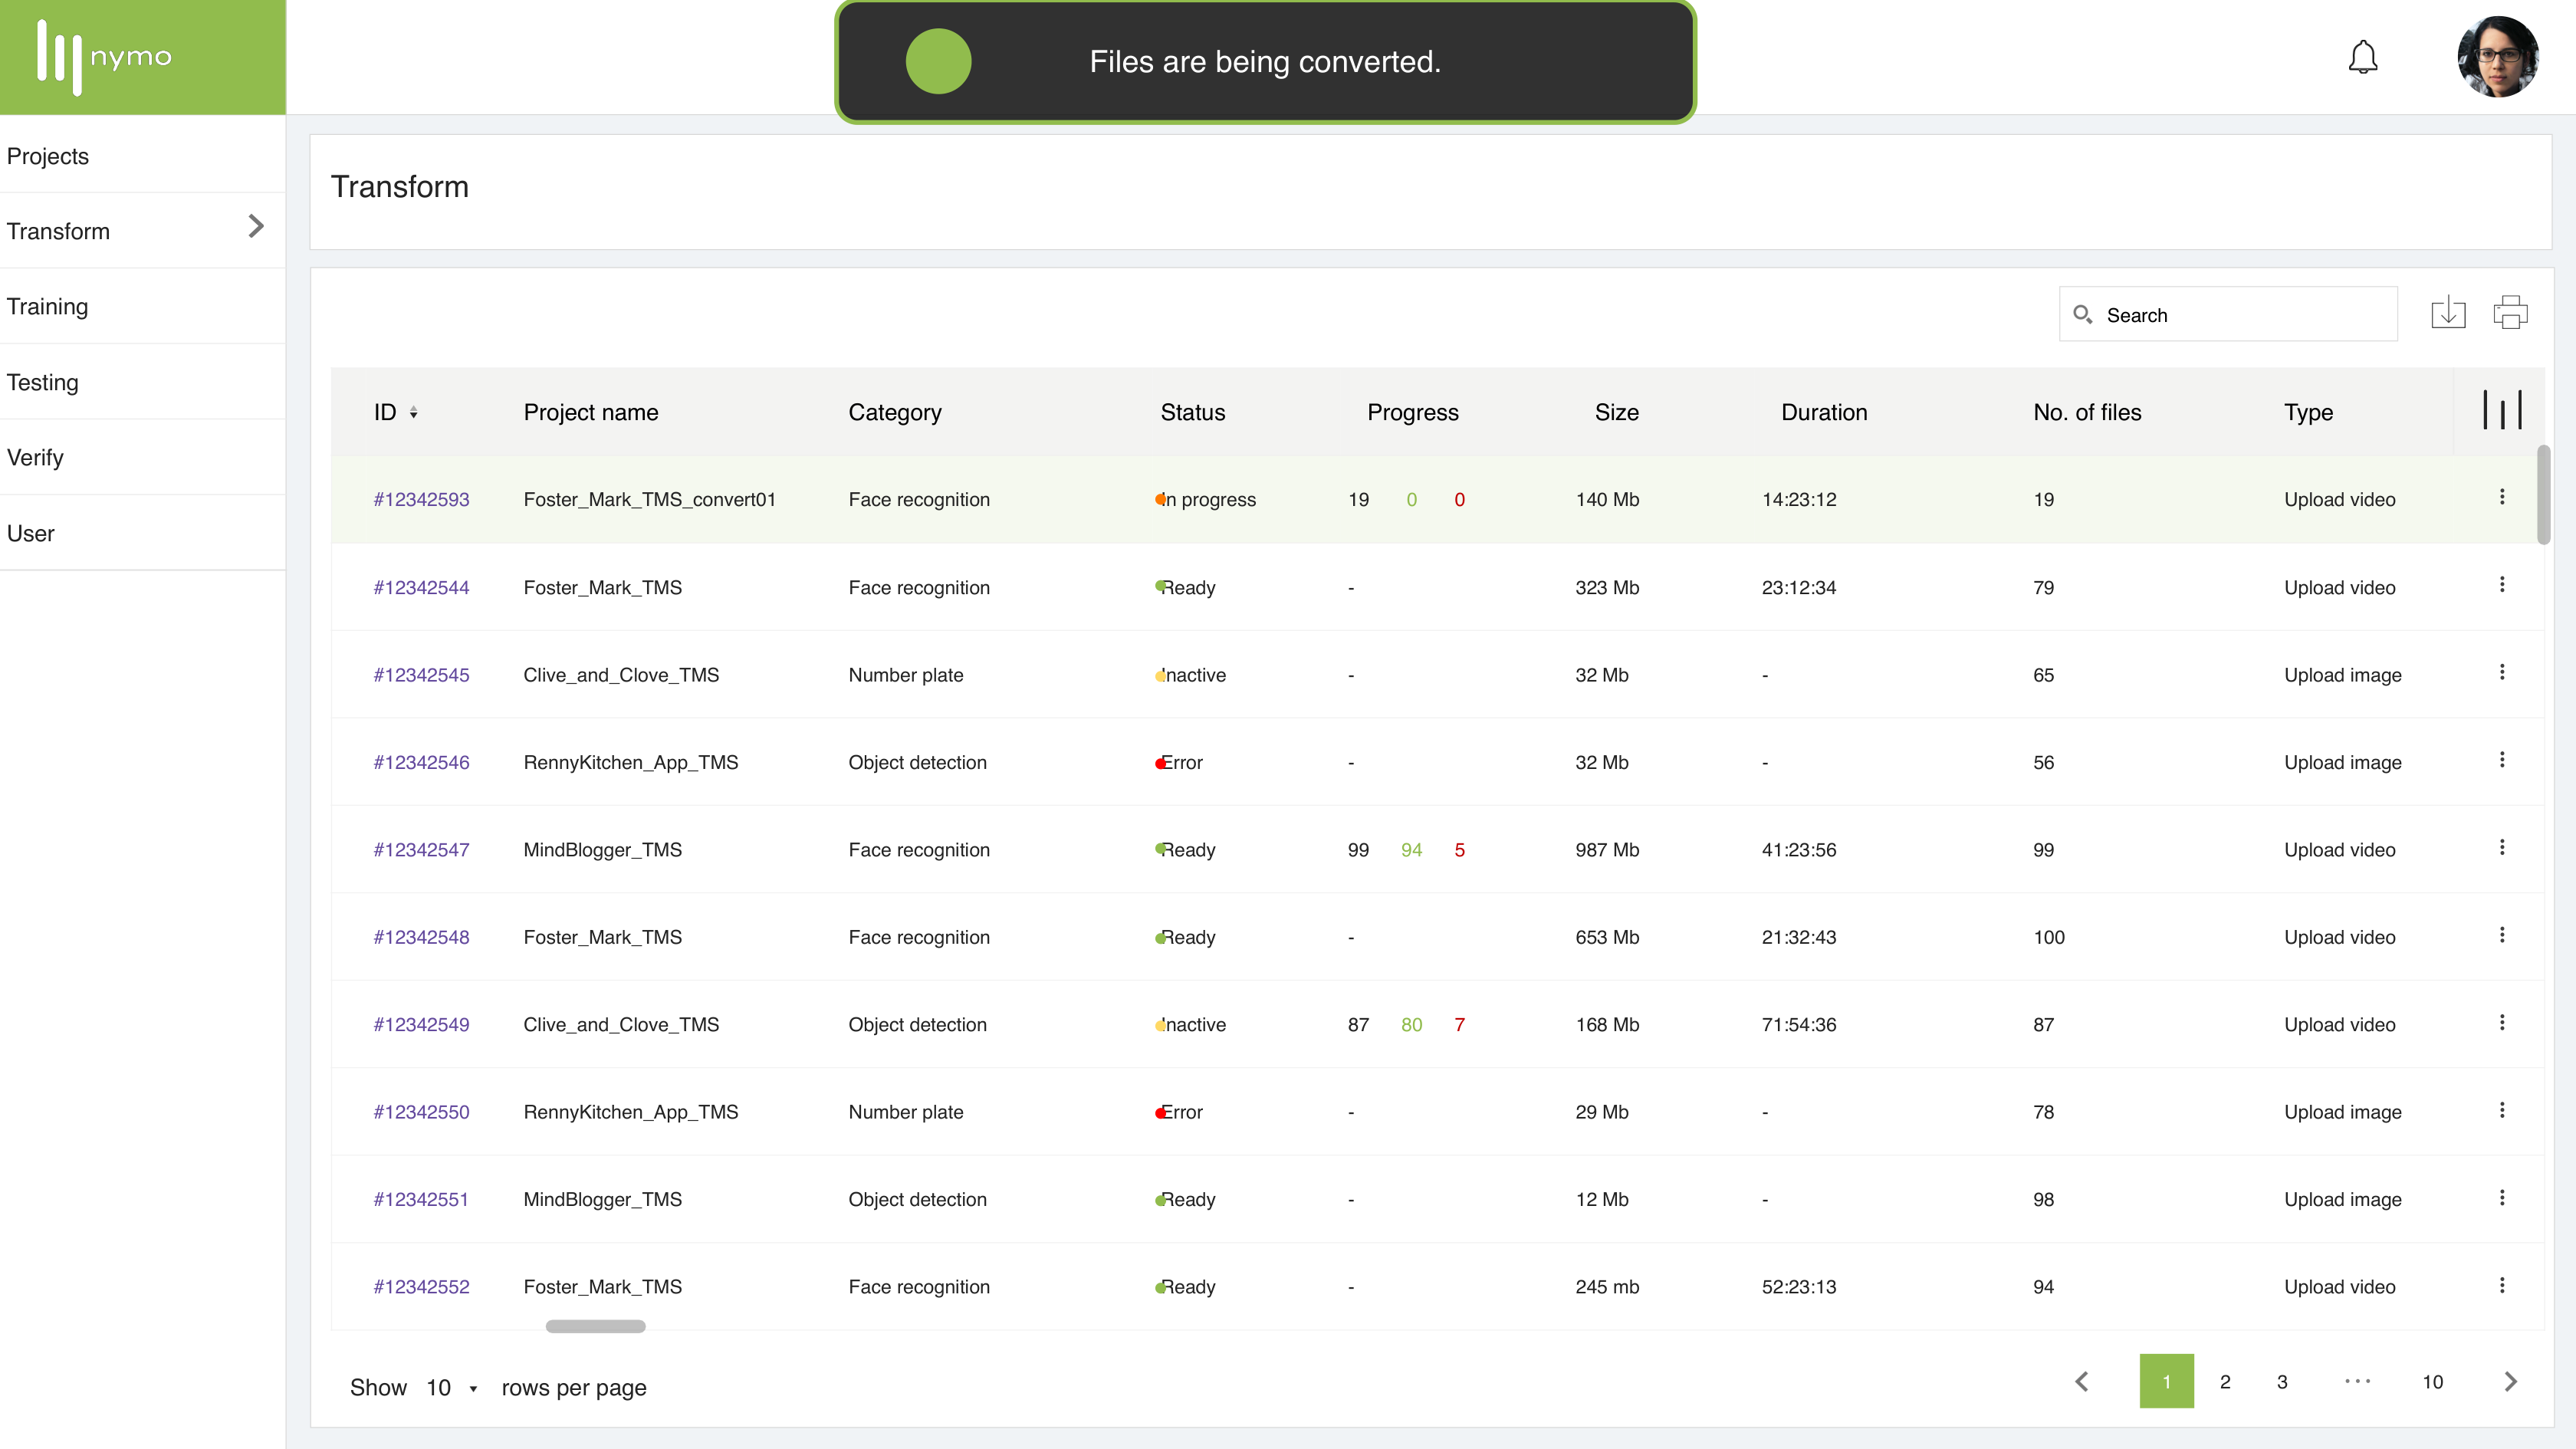
When an operation is triggered, the user returns to the project list immediately. A toast confirms the job started. The new child project appears at the top of the table in In Progress status with the three-number indicator updating in real time.

  • Analysts do not wait. They move to the next project. This directly addressed the parallelism problem from Finding 04.
  • Errors surface in the table — not after annotation fails. The moment a file errors, the count changes and the row becomes actionable.
Toast notification confirming conversion started, with the child project appearing at the top of the project table in In Progress status and live progress counts

History Log

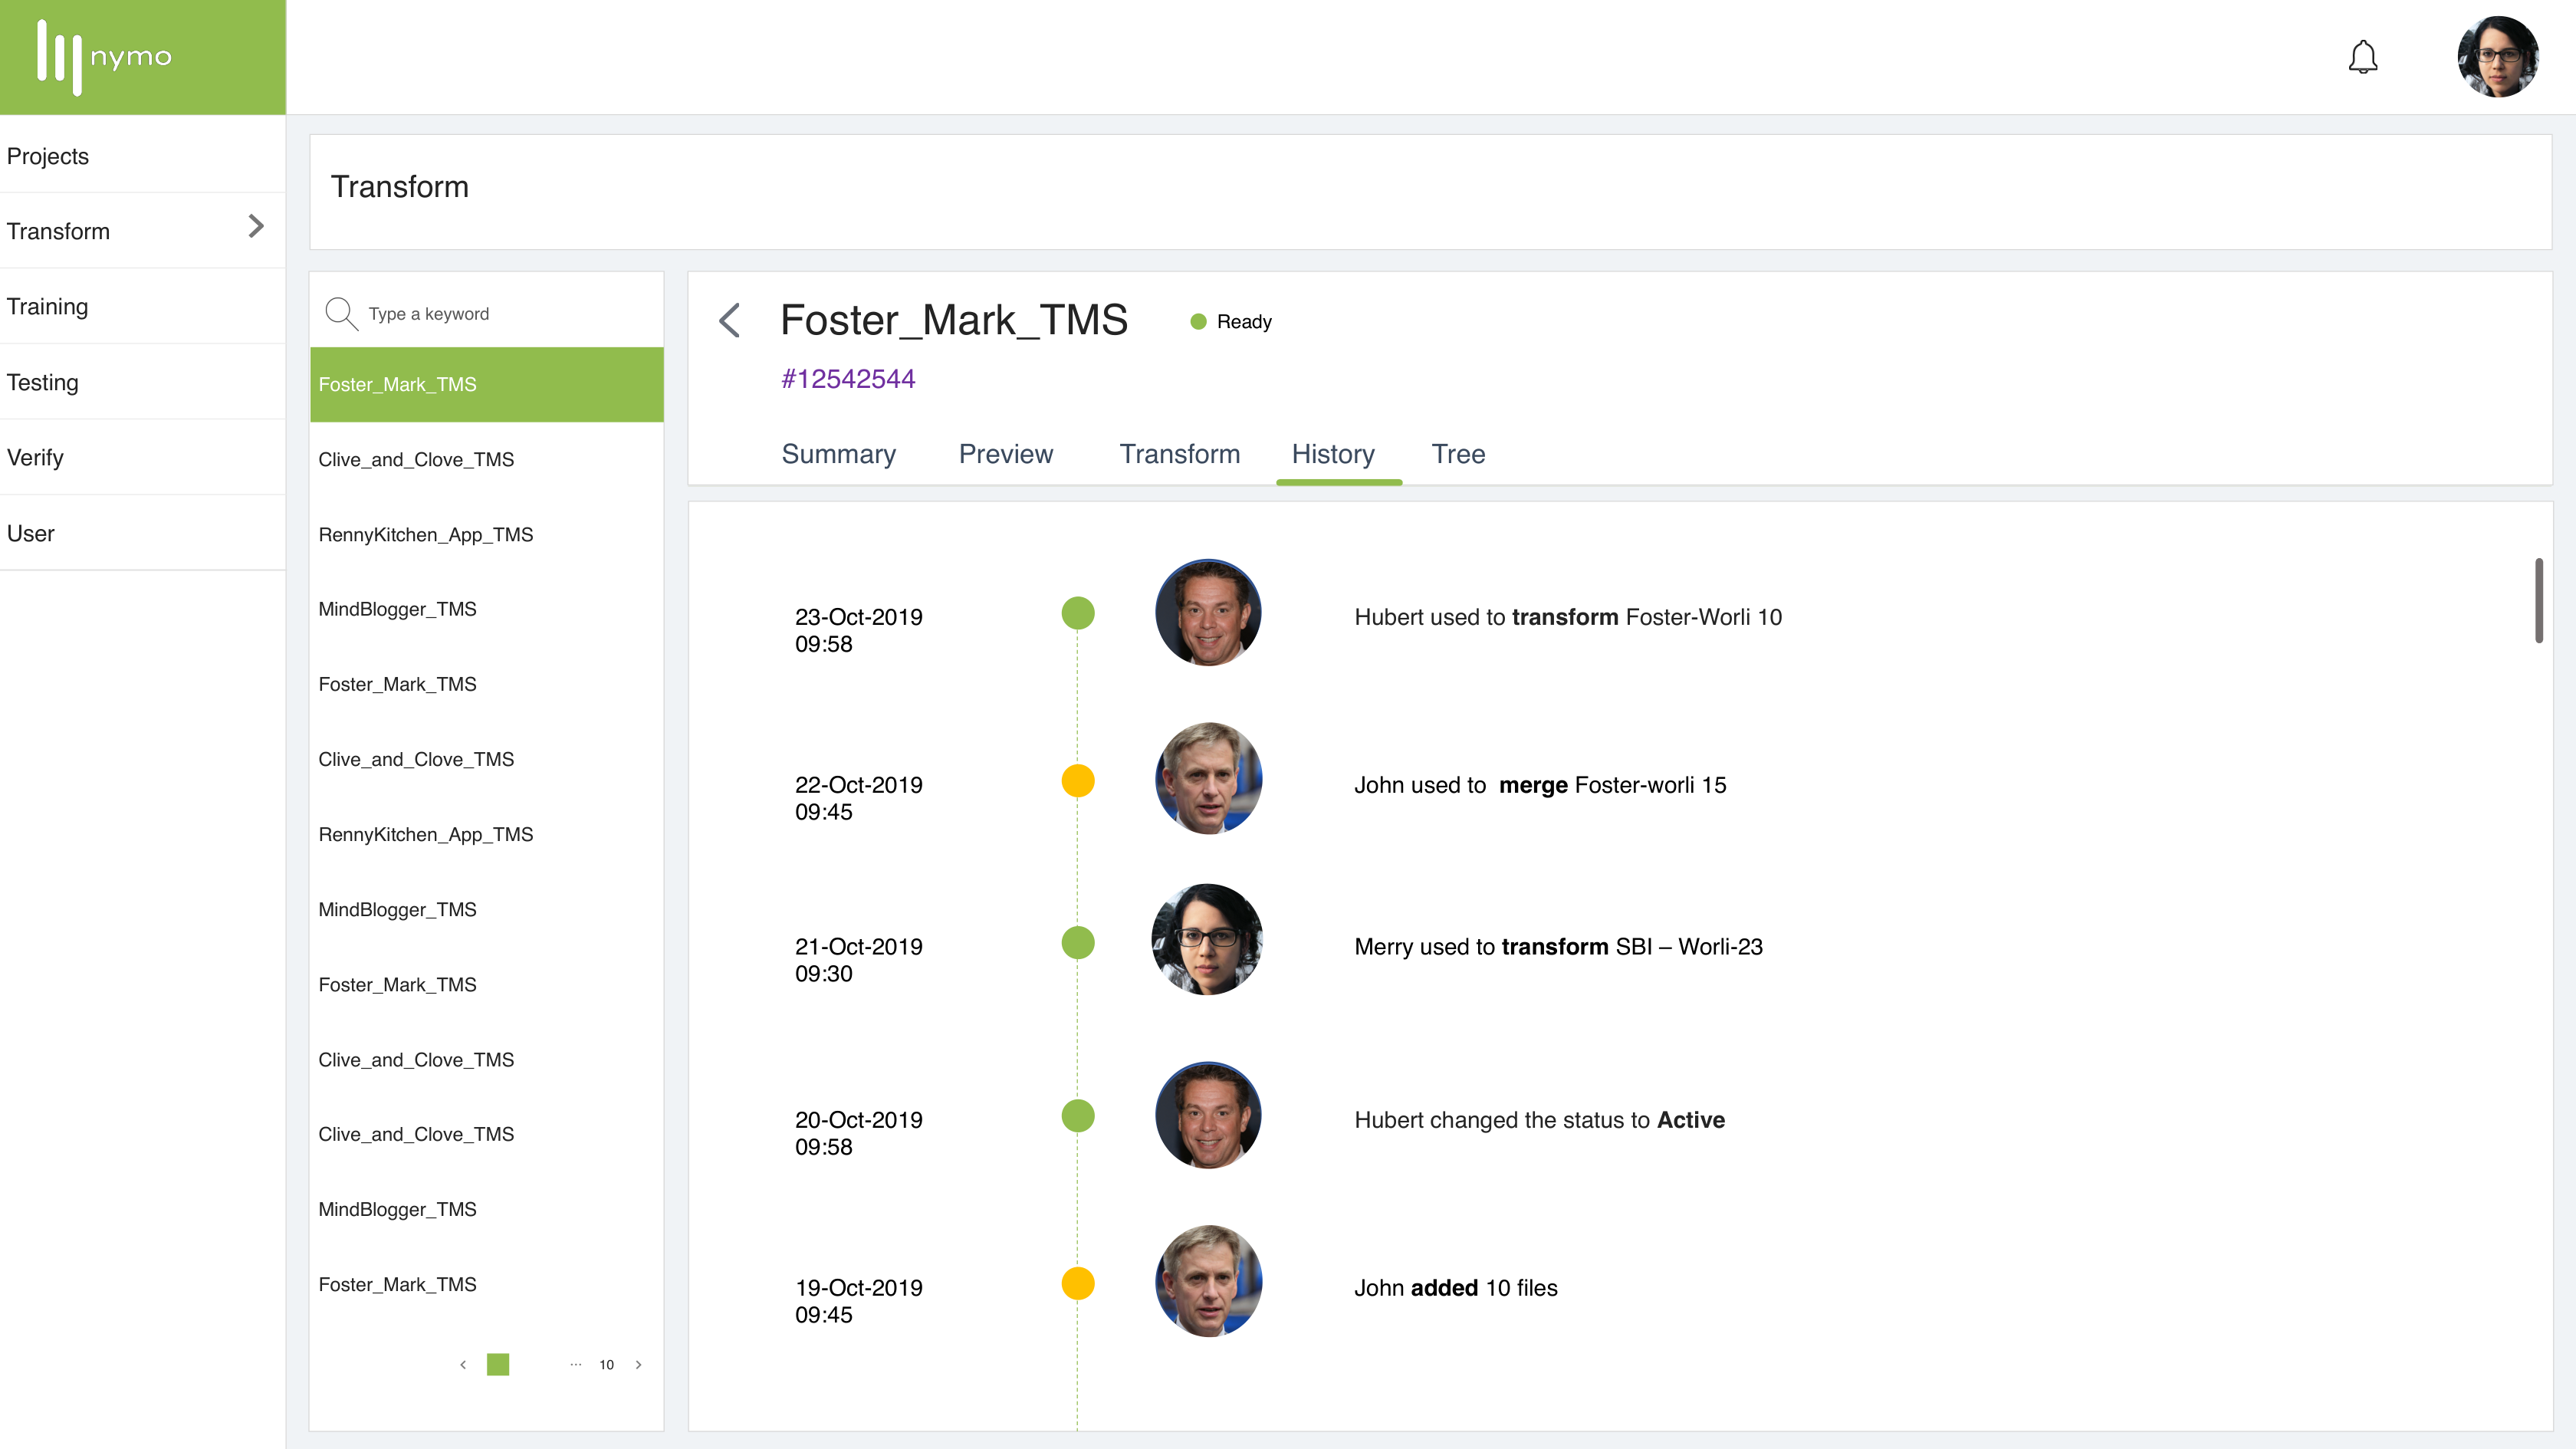
Every project has a History tab showing a chronological activity timeline. Avatar, timestamp, plain-language action. Conversational format because the audience is not only engineers — leads and client stakeholders read this log. A plain sentence is more useful than a system event string.

  • "Hubert used to transform Foster-Worli 10."
  • "John added 10 files."
History tab showing a chronological activity timeline with user avatars, plain-language action descriptions and timestamps — Hubert transformed, John merged, Merry transformed, Hubert changed status, John added files

Tree View — The Decision That Mattered Most

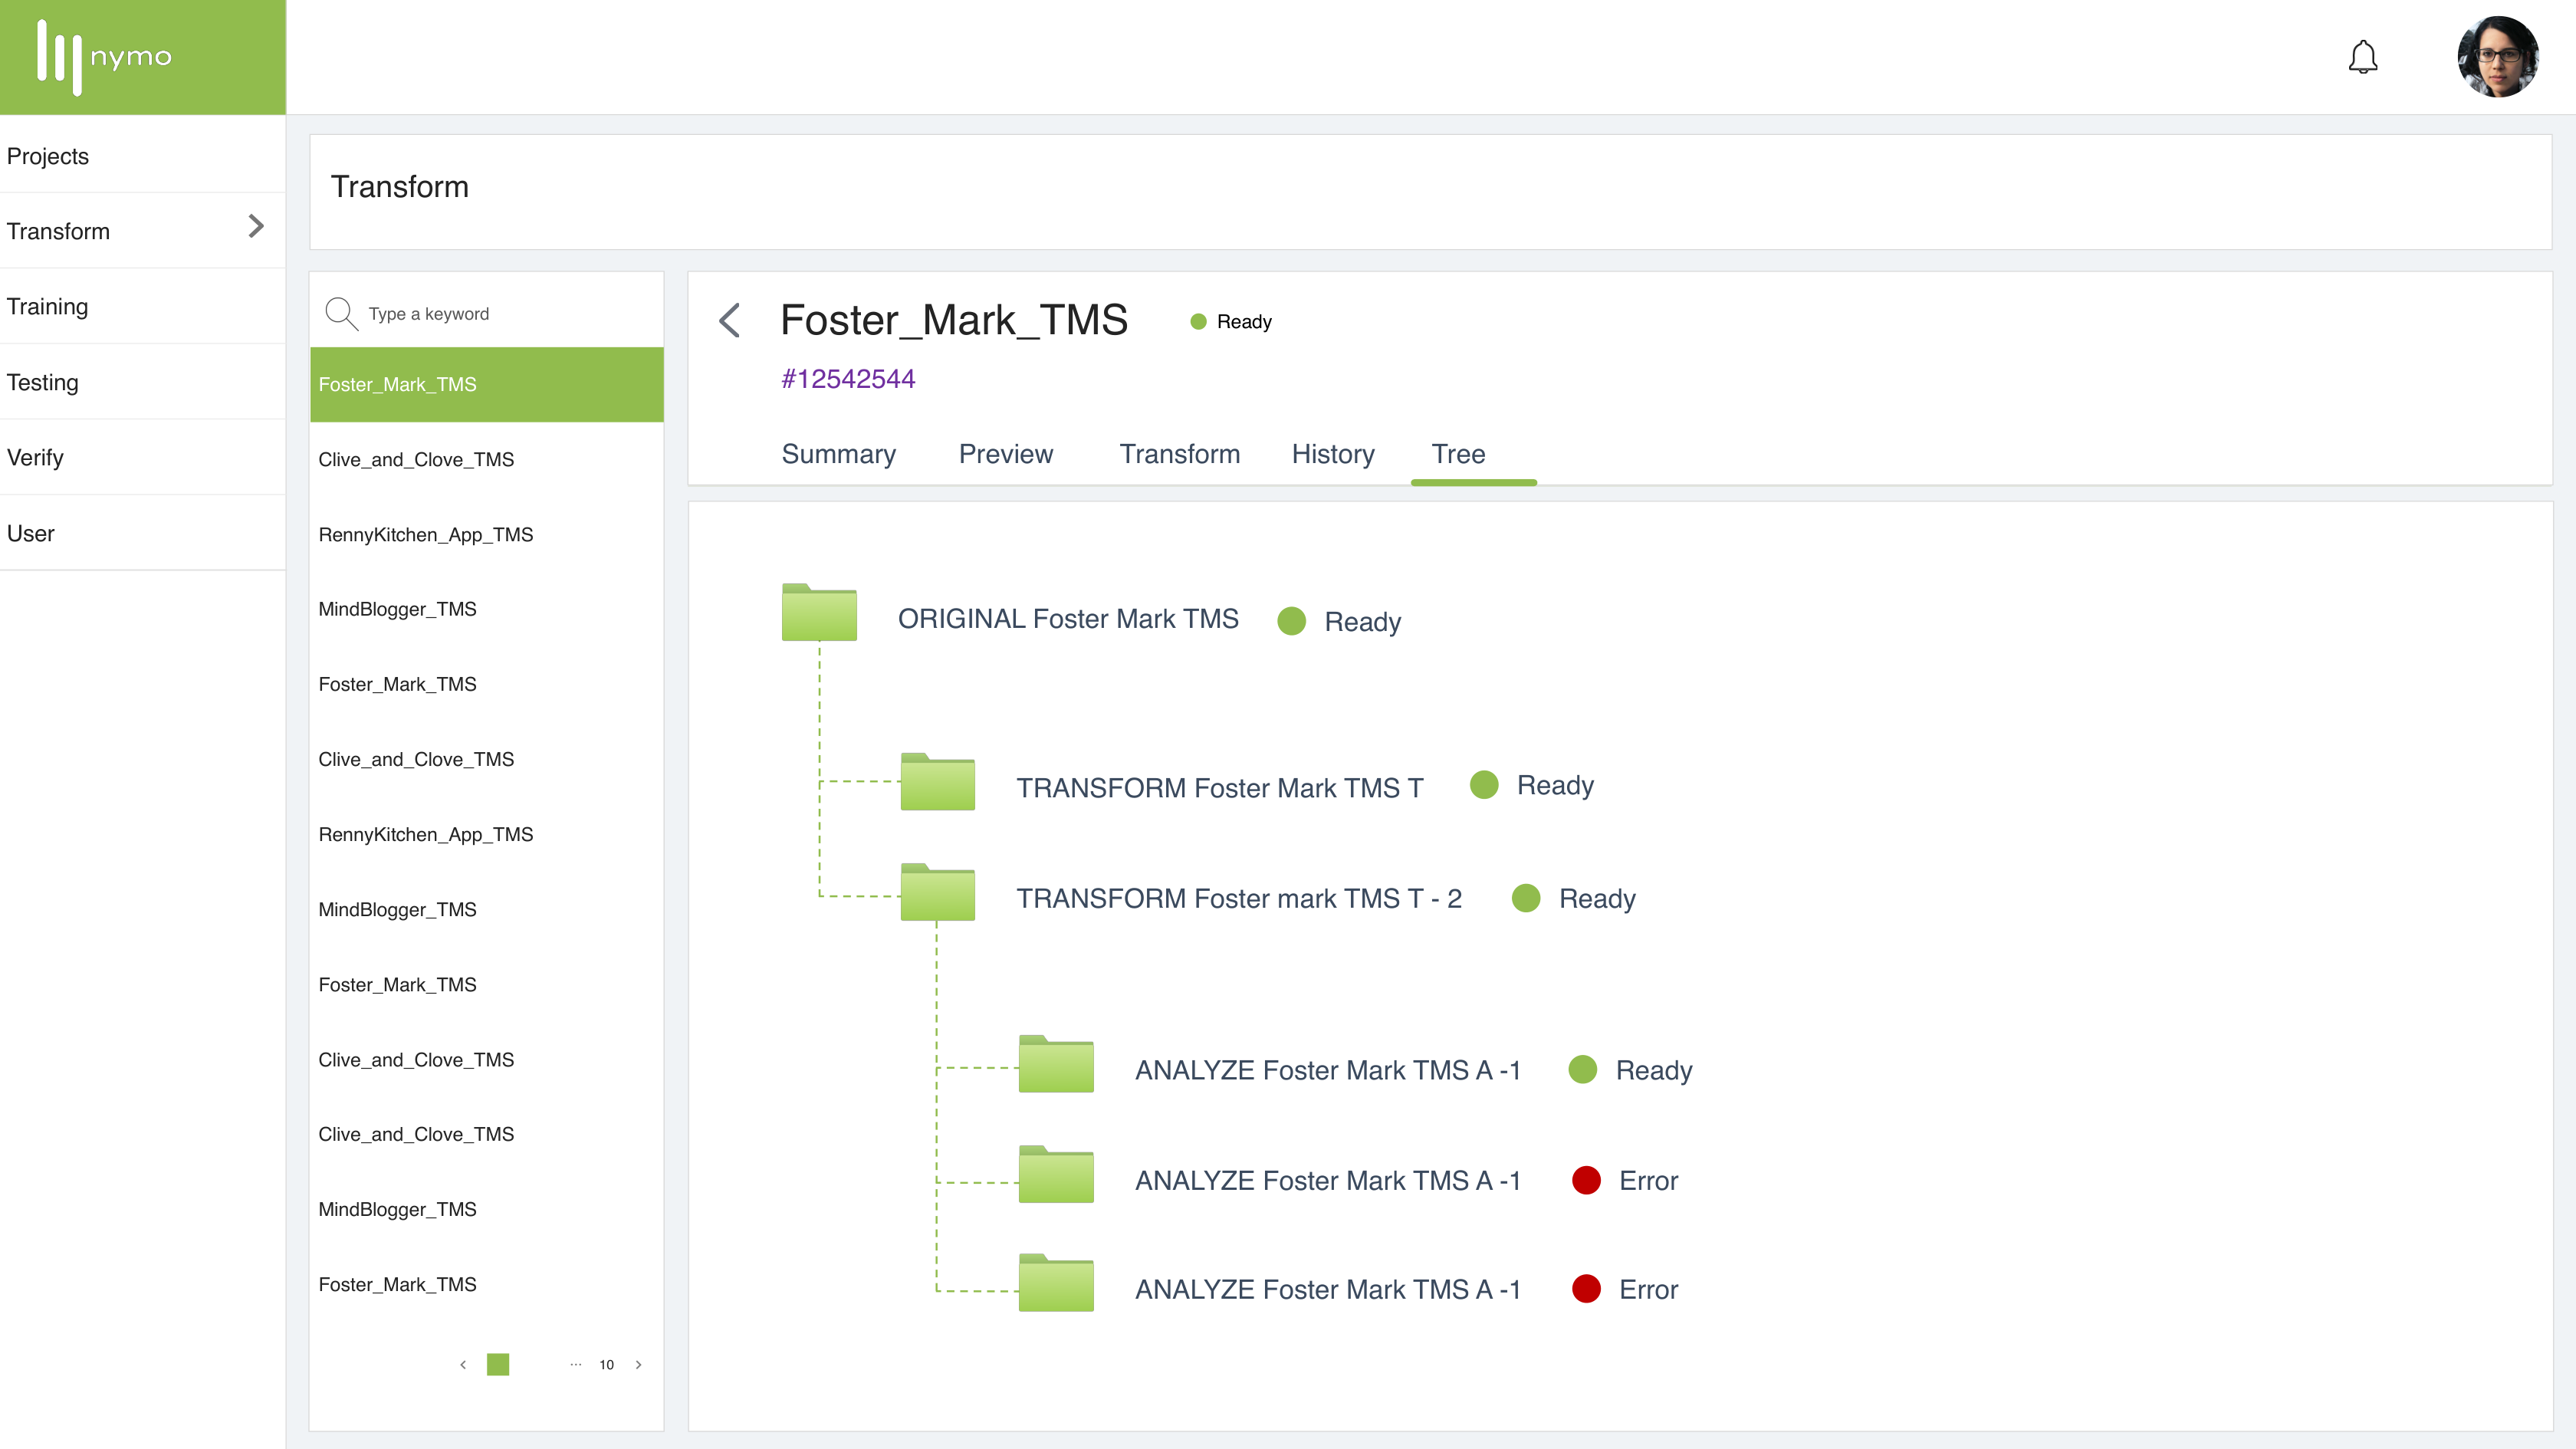
Every transformation creates a child project. The Tree tab shows this hierarchy: the original at the root, transform branches below it, each labelled with operation type and current status.

  • Diagnostic, not just audit. When an ML engineer reports model underperformance on specific clips, they open the Tree and trace which transformations were applied, in what order, and whether any threw errors. No guessing. No Slack archaeology.
  • Made the non-destructive rule visible. Seeing the tree showed analysts their originals were always safe — something the V1 wizard never communicated.
  • Started as a nice-to-have on a Miro board. Ended up being the feature that changed how engineers diagnosed model failures.
Tree view showing hierarchical transformation lineage — original Foster Mark TMS project at root with Transform T, Transform T-2, and Analyze branches showing Ready and Error status indicators

Three Decisions Worth Examining

These are not the most visible decisions in the interface. They are the ones that required the clearest trade-off thinking — and the ones most likely to be questioned in a design review.

DECISION 01 — PROGRESS COLUMN

Three Raw Counts vs. a Percentage Bar

The decision: show three raw counts (total / processed / errored) in colour rather than a single percentage bar.

Why it matters: A percentage bar collapses the most critical information. A project showing 95% complete looks like success. Three numbers show the truth: 95 processed, 5 errored out of 100. Operations leads cannot act on a percentage — they can act on knowing 5 files have failed. The counts also communicate scale that a bar cannot: 5 errors in a 10-file project is a crisis; 5 errors in a 1,000-file project is noise. Same percentage, completely different meaning.

CONSIDERED
95% — looks fine, hides 5 errors
CHOSEN
100 95 5
Total / OK / Errors — immediately actionable
DECISION 02 — FILE PREVIEW PANEL

Inline Panel vs. Modal Overlay

The decision: open file preview as an inline panel within the content area, not as a modal or new screen.

Why it matters: This decision came directly from V1 testing. The wizard closed context when analysts navigated away. Any pattern that interrupts the parameter-setting workflow — even a modal — would repeat the same failure. An inline panel means the analyst can check a file's metadata (resolution, fps, duration) and immediately continue setting parameters without losing any state. The cost is screen complexity. The benefit is that a usability failure I already observed does not happen again.

CONSIDERED
Modal overlay
Interrupts parameter flow
CHOSEN
Preview
metadata
stays open
State preserved, no interruption
DECISION 03 — TREE VIEW

Hierarchical Tree vs. Extended History Log

The decision: build a hierarchical tree showing full transformation lineage, not an extended flat history log.

Why it matters: The History log answers "what happened in this project." The Tree answers "where did this file come from and what happened to it." These are different questions. When an ML engineer is debugging model underperformance, they need to navigate lineage spatially — to see that the file they're looking at is three transformations removed from the original, that two ran cleanly, and that one produced an error. A flat log requires reading and mental reconstruction. The tree makes the structure visible at a glance. This was the single feature that changed how the team diagnosed training data failures.

What Shipped & What Changed

3 → 1
Tools consolidated into one module (VLC, FFmpeg CLI, local editor)
~60%
Less time on footage prep; 30–40 manual re-exports per day dropped to near zero
<5 min
To trace a model error back to a transformation (was: half a day of Slack archaeology)
First
Full audit trail in the platform — leads and clients can see exactly who changed what and when

The Shift That Surprised Us

The Tree view started as an audit feature for compliance. It ended up becoming a diagnostic tool for performance debugging — something none of us anticipated when it was a sticky note on a Miro board. ML engineers used it to trace model failures to specific transformations and parameters. That shift only happened because I kept talking to the people downstream of this work.

Reflection — What I Would Do Differently

Next
ActOn AI — Incident Management
Also
AgenZ
Also
Dashboard Accessibility