Overview
Modernising Security Dashboards
At Netenrich, our security dashboards relied on a colour palette that had grown organically over time — muddy, inconsistent, and failing basic accessibility checks. The initial brief was simple: "update the chart colours."
I reframed the scope from a cosmetic refresh to a strategic initiative: ship an accessible, modern, tokenised colour palette that would unify every module, pass AA compliance, and work for users with colour vision deficiencies. This reframing unlocked executive buy-in and expanded the project into a full interaction-enhancement effort.
The Problem
What Was Breaking
Through auditing existing dashboards and interviewing analysts, two core problems emerged that were undermining trust in the data visualisations.
Hard to Scan Charts
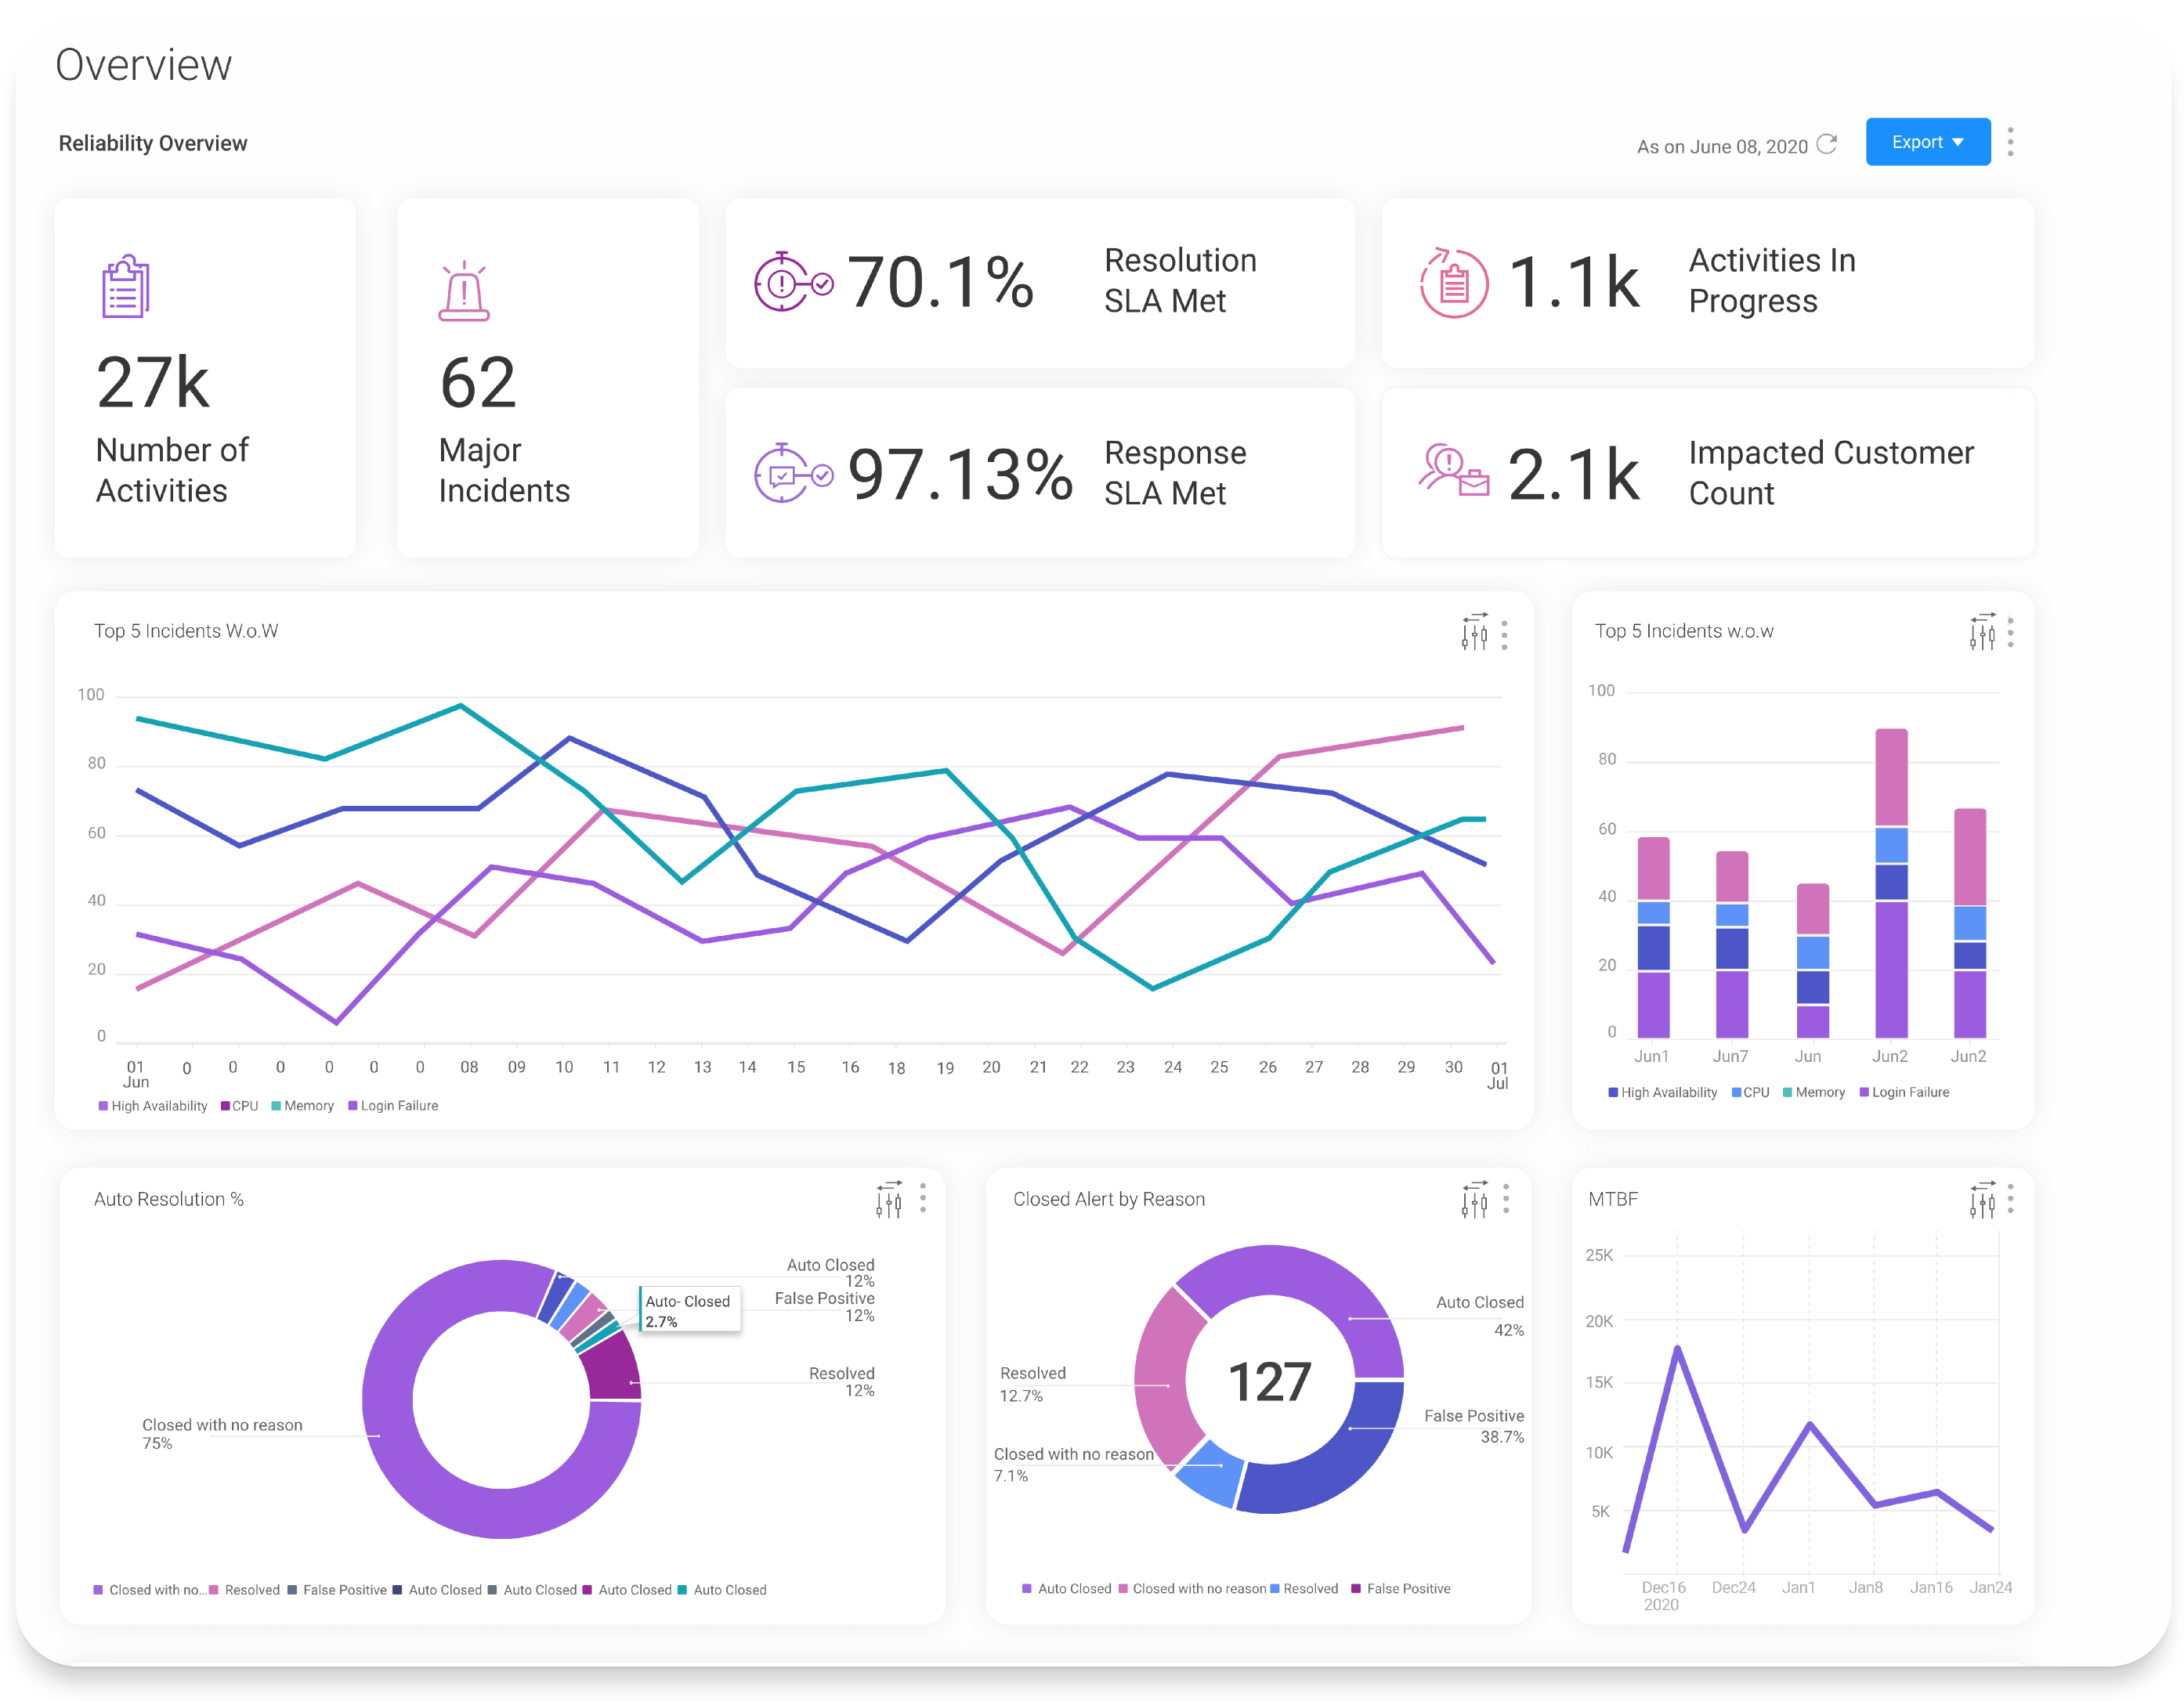
Similar colours caused visual clutter in dense data visualisations. Analysts struggled to differentiate between adjacent chart segments, leading to misreadings and slower decision-making during incident triage.
Outdated & Inconsistent
Different modules used different palettes with no unified system. A bar chart in one dashboard used completely different hues than a pie chart in another, breaking visual continuity and eroding user confidence.
"I can tell you the shape of the chart. I cannot always tell you which line is which. After an hour on this screen, the colours blur into each other."
— Security analyst, interview session 2
Original dashboard as shipped — muddy, similar-hue colours across all chart types. Analysts were misreading segments during incident triage.
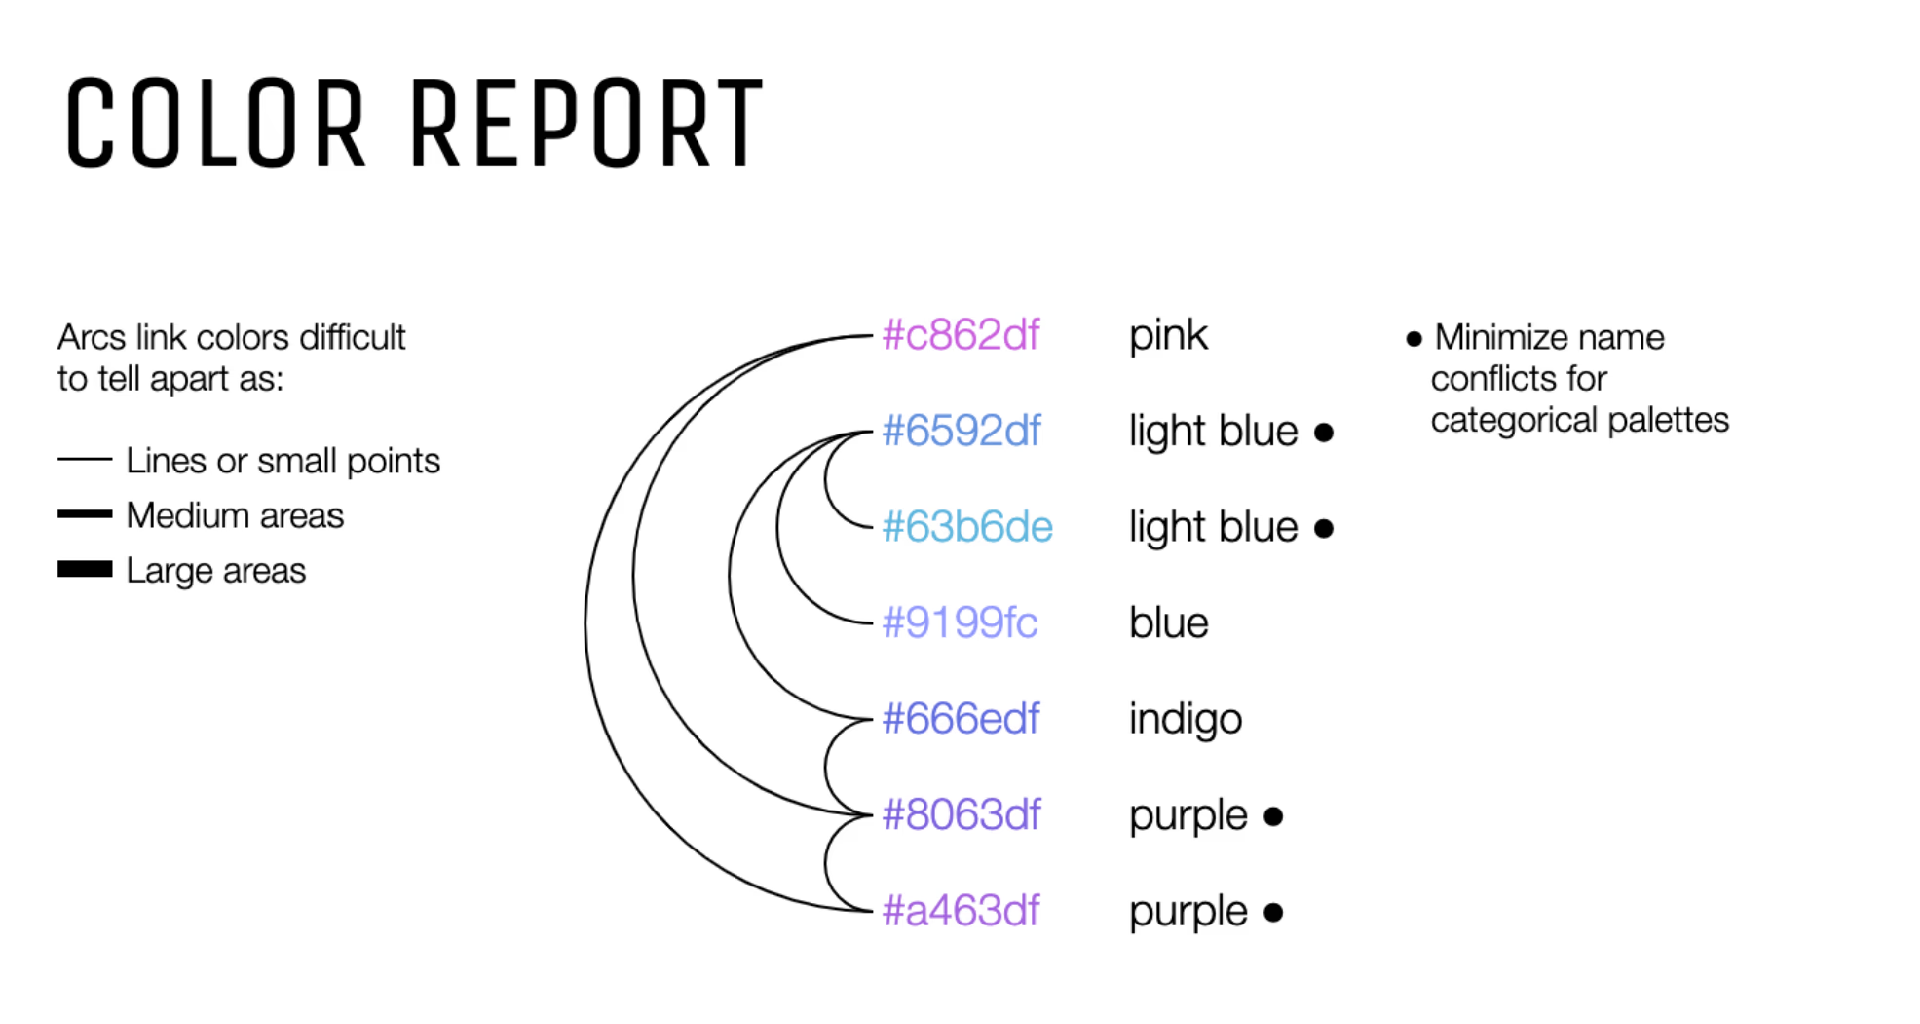
Color Report — hue clustering analysis. 7 of 12 original colours fall in the same purple-blue-pink family, impossible to tell apart at small sizes.
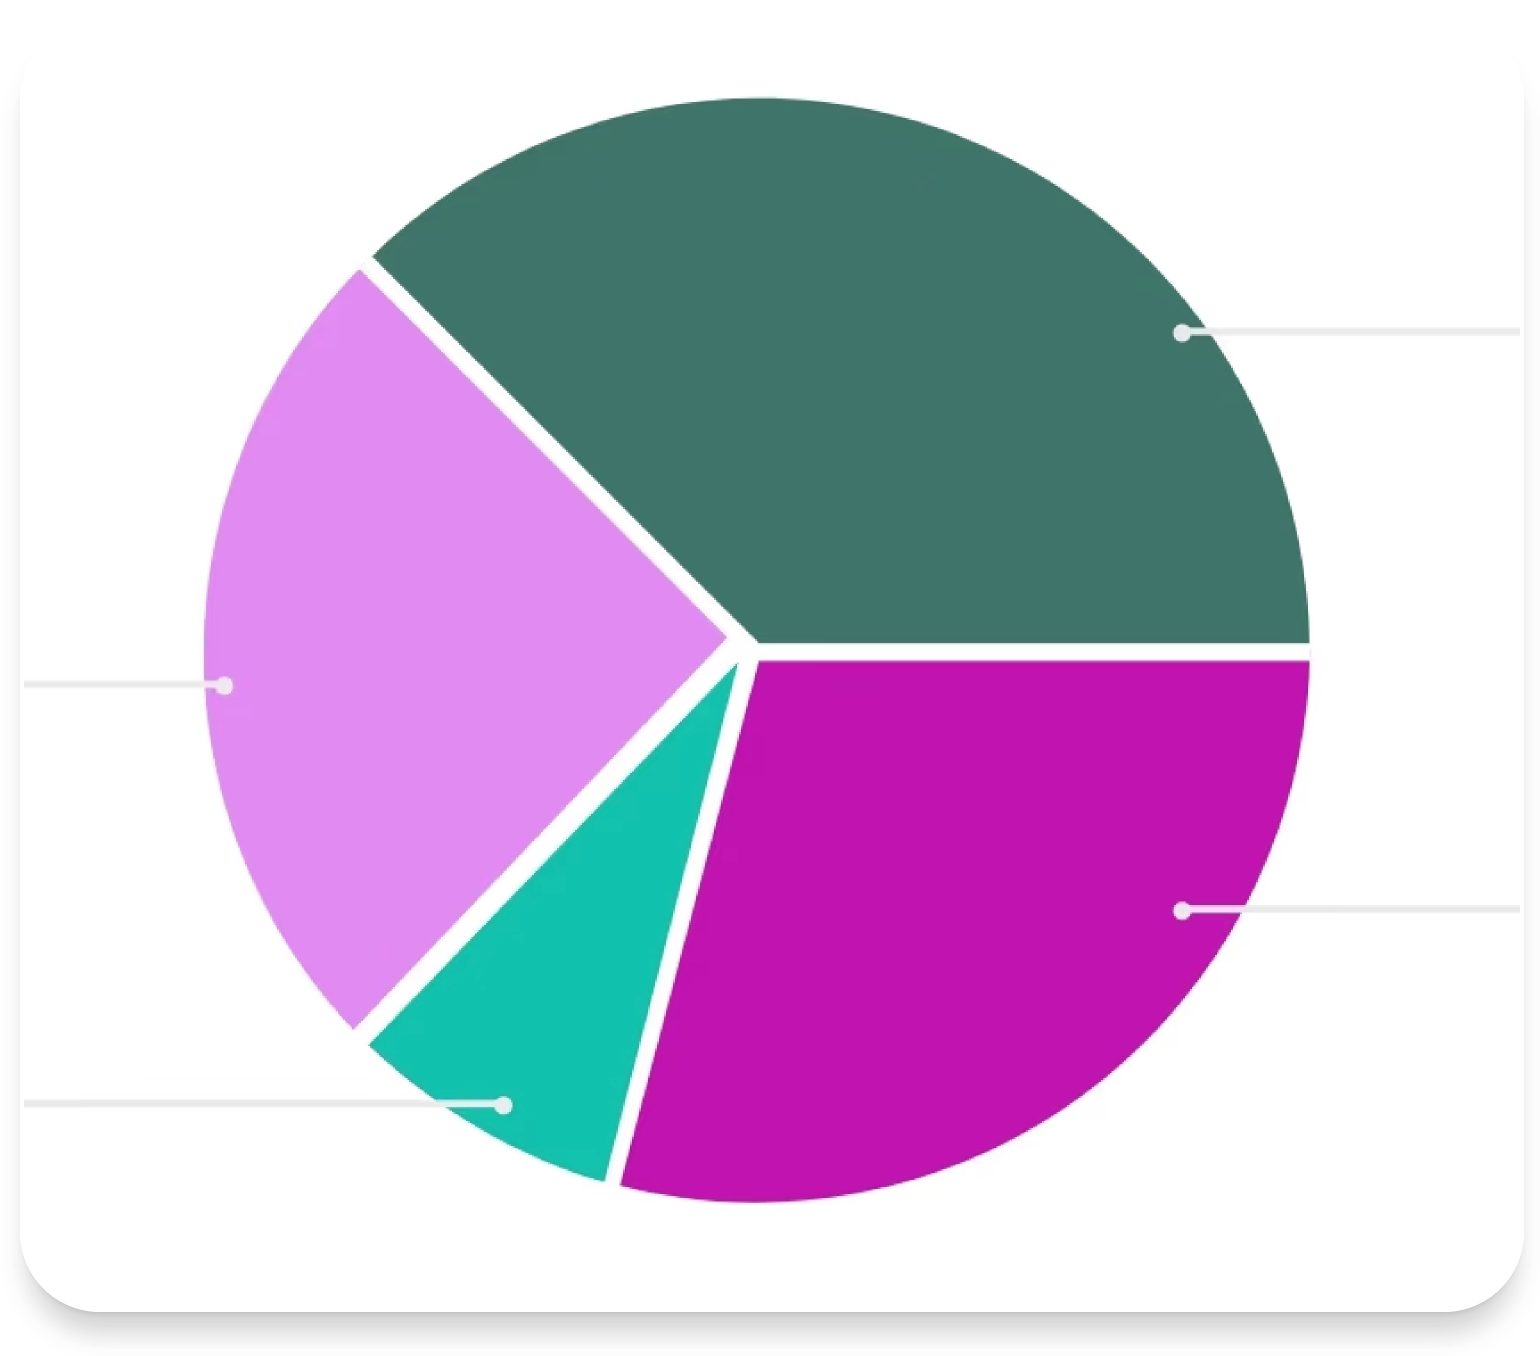
Pie chart — live example of the problem. Segments near-indistinguishable under normal vision, far worse under CVD.
The First Obstacle
The Brief Said "Update the Colours." I Said That's the Wrong Problem.
The initial brief from product was narrow: swap the chart colours, done. Two weeks, no user research required.
I pushed back. Not because I wanted a bigger project — because swapping colours without a palette system would put us in the same position in 18 months. A new module would ship with a new palette. Another module would drift. The inconsistency wasn't cosmetic; it was structural.
Getting buy-in for a broader scope required reframing the ask: not "better colours" but "a tokenised palette system that every module inherits and that passes WCAG AA compliance." That framing connected to risk (legal accessibility requirements), to engineering cost (one system vs. twelve), and to user trust (data that looks unreliable, is treated as unreliable).
The pushback took two weeks to resolve. It was worth it.
Research & Process
Finding the Right Palette
I explored two distinct approaches to palette creation — algorithmic generation using tools like Coblis, Colorlogical, and Adobe Color, versus manual crafting informed by colour theory and domain expertise.
JND & CVD Analysis
- Just Noticeable Difference (JND) analysis using Viz Palette ensured that adjacent colours in any chart would be perceptually distinct — even at small sizes.
- CVD Simulations tested: Protanomaly, Deuteranomaly, Tritanomaly, Protanopia, Deuteranopia, Tritanopia, Achromatopsia, and Blue Cone Monochromacy.
- Key trade-off: Perfect CVD coverage across all eight conditions would have required desaturating the palette to the point of losing contrast within the normal-vision hue spectrum. We optimised for strong contrast within hue families while maintaining usability across the most common CVD types.
- Algorithmic tools got us 70% there — the remaining 30% required manual refinement, testing against real dashboard data, and iteration based on analyst feedback.
Contrast Ratio Audit — Original Palette

Original palette contrast audit — red-boxed values (1.97:1) far below the WCAG AA minimum of 3:1 for graphical elements.

Extended audit of colour variants — failure rates above 40% across the tested range, confirming a systemic issue not an isolated one.
Palette Iteration — Perceptual Separation Testing

Iteration 3 — reduced hue clustering, improved perceptual separation. Contrast ratios trending above 3:1 across the majority.

Iteration 4 — balancing saturation depth and hue distance. Approaching a palette that works both analytically and visually.
CVD Simulation Testing
Each candidate palette was simulated across 8 colour vision deficiency types — from common anomalous trichromacy to rare blue-cone monochromacy. We tested two manual palettes in full before making the final selection.
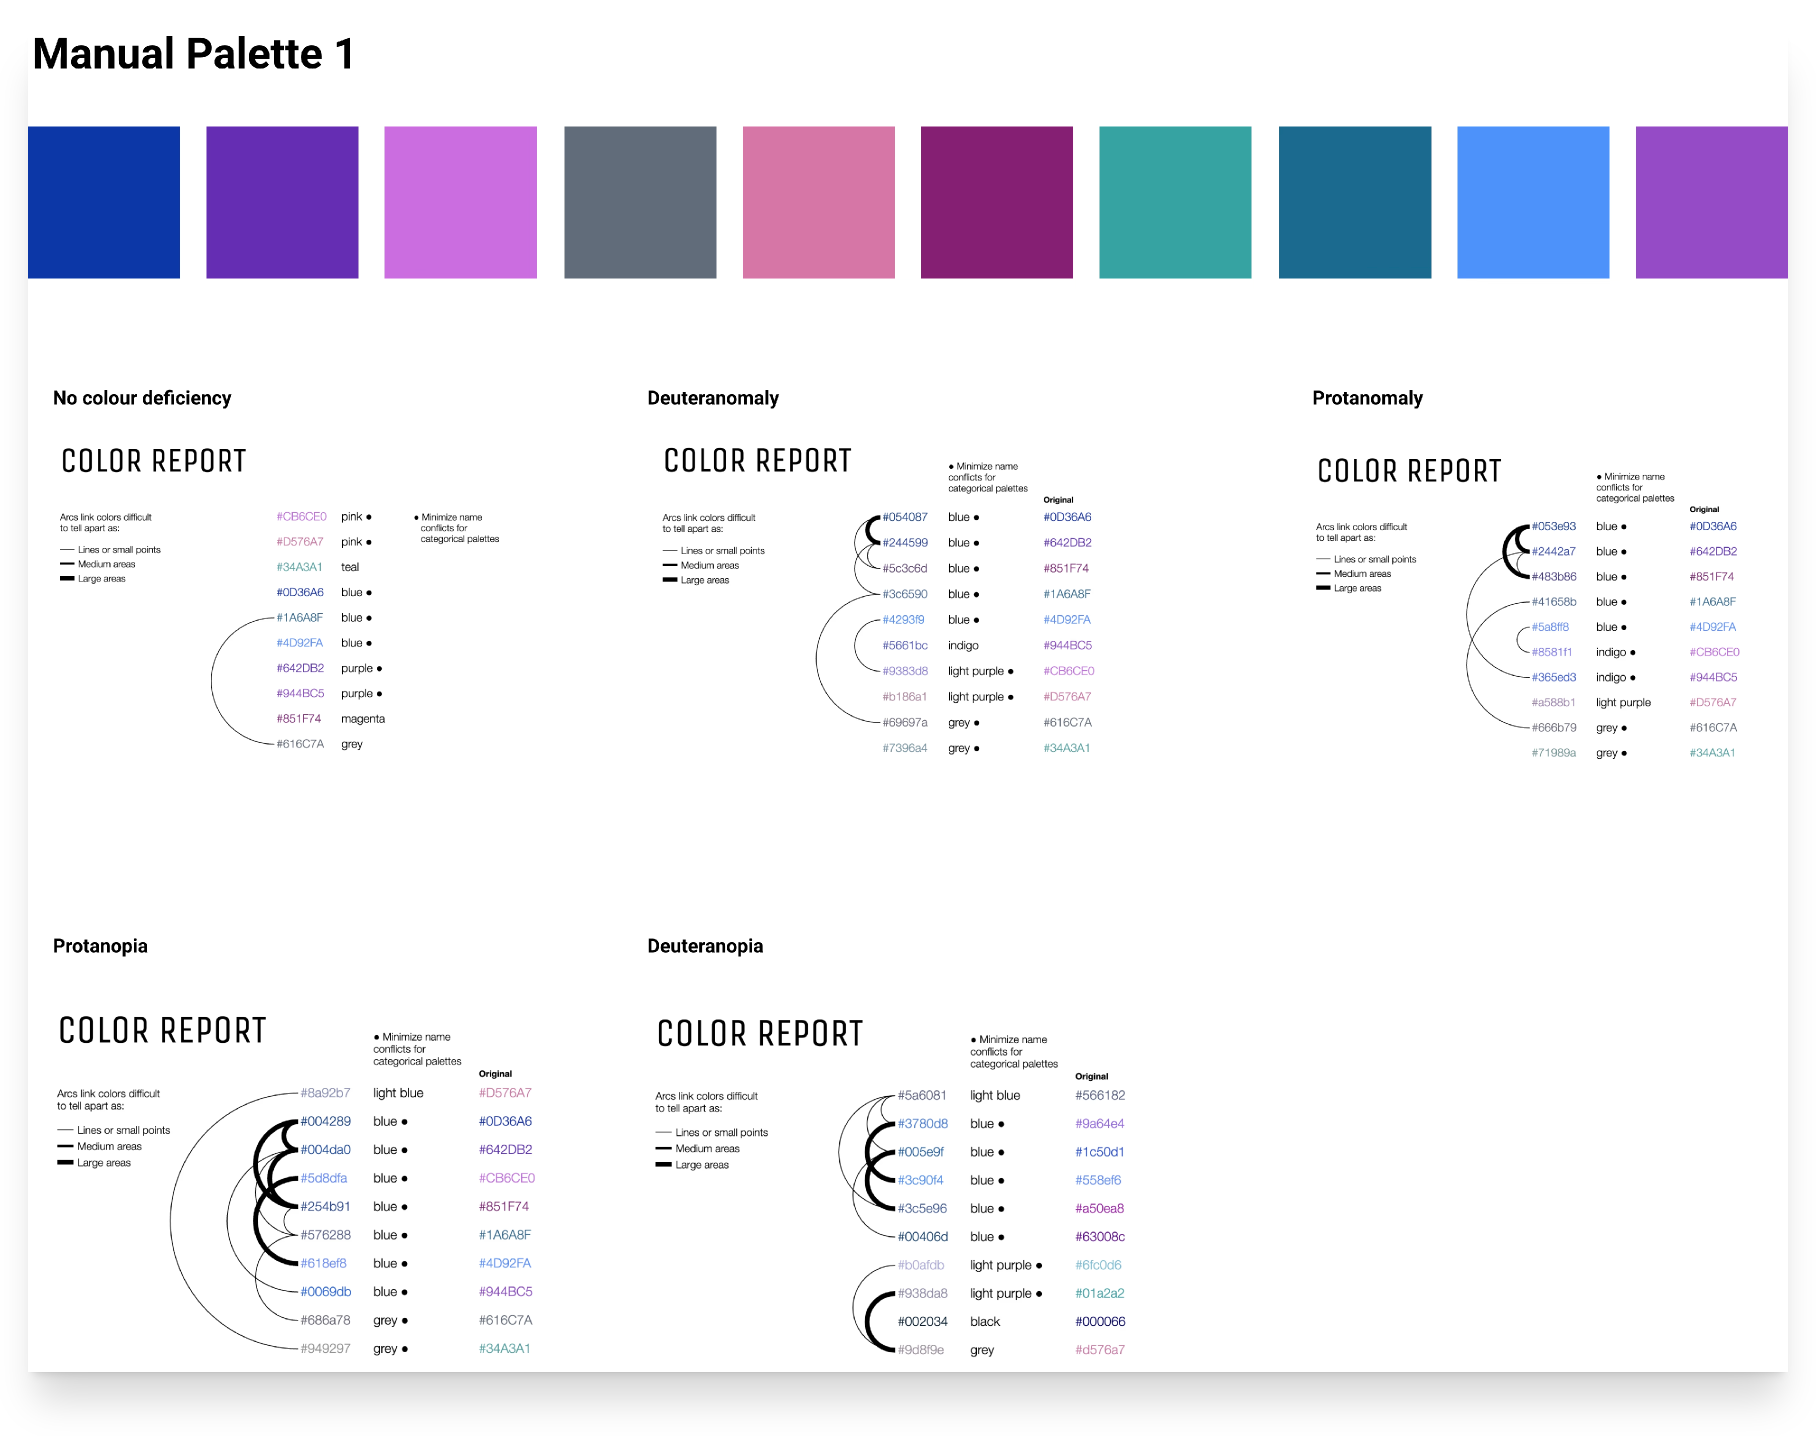
Manual Palette 1 — CVD simulation across 5 vision types. Hue separation is maintained across Deuteranomaly and Protanomaly (the two most common deficiencies).
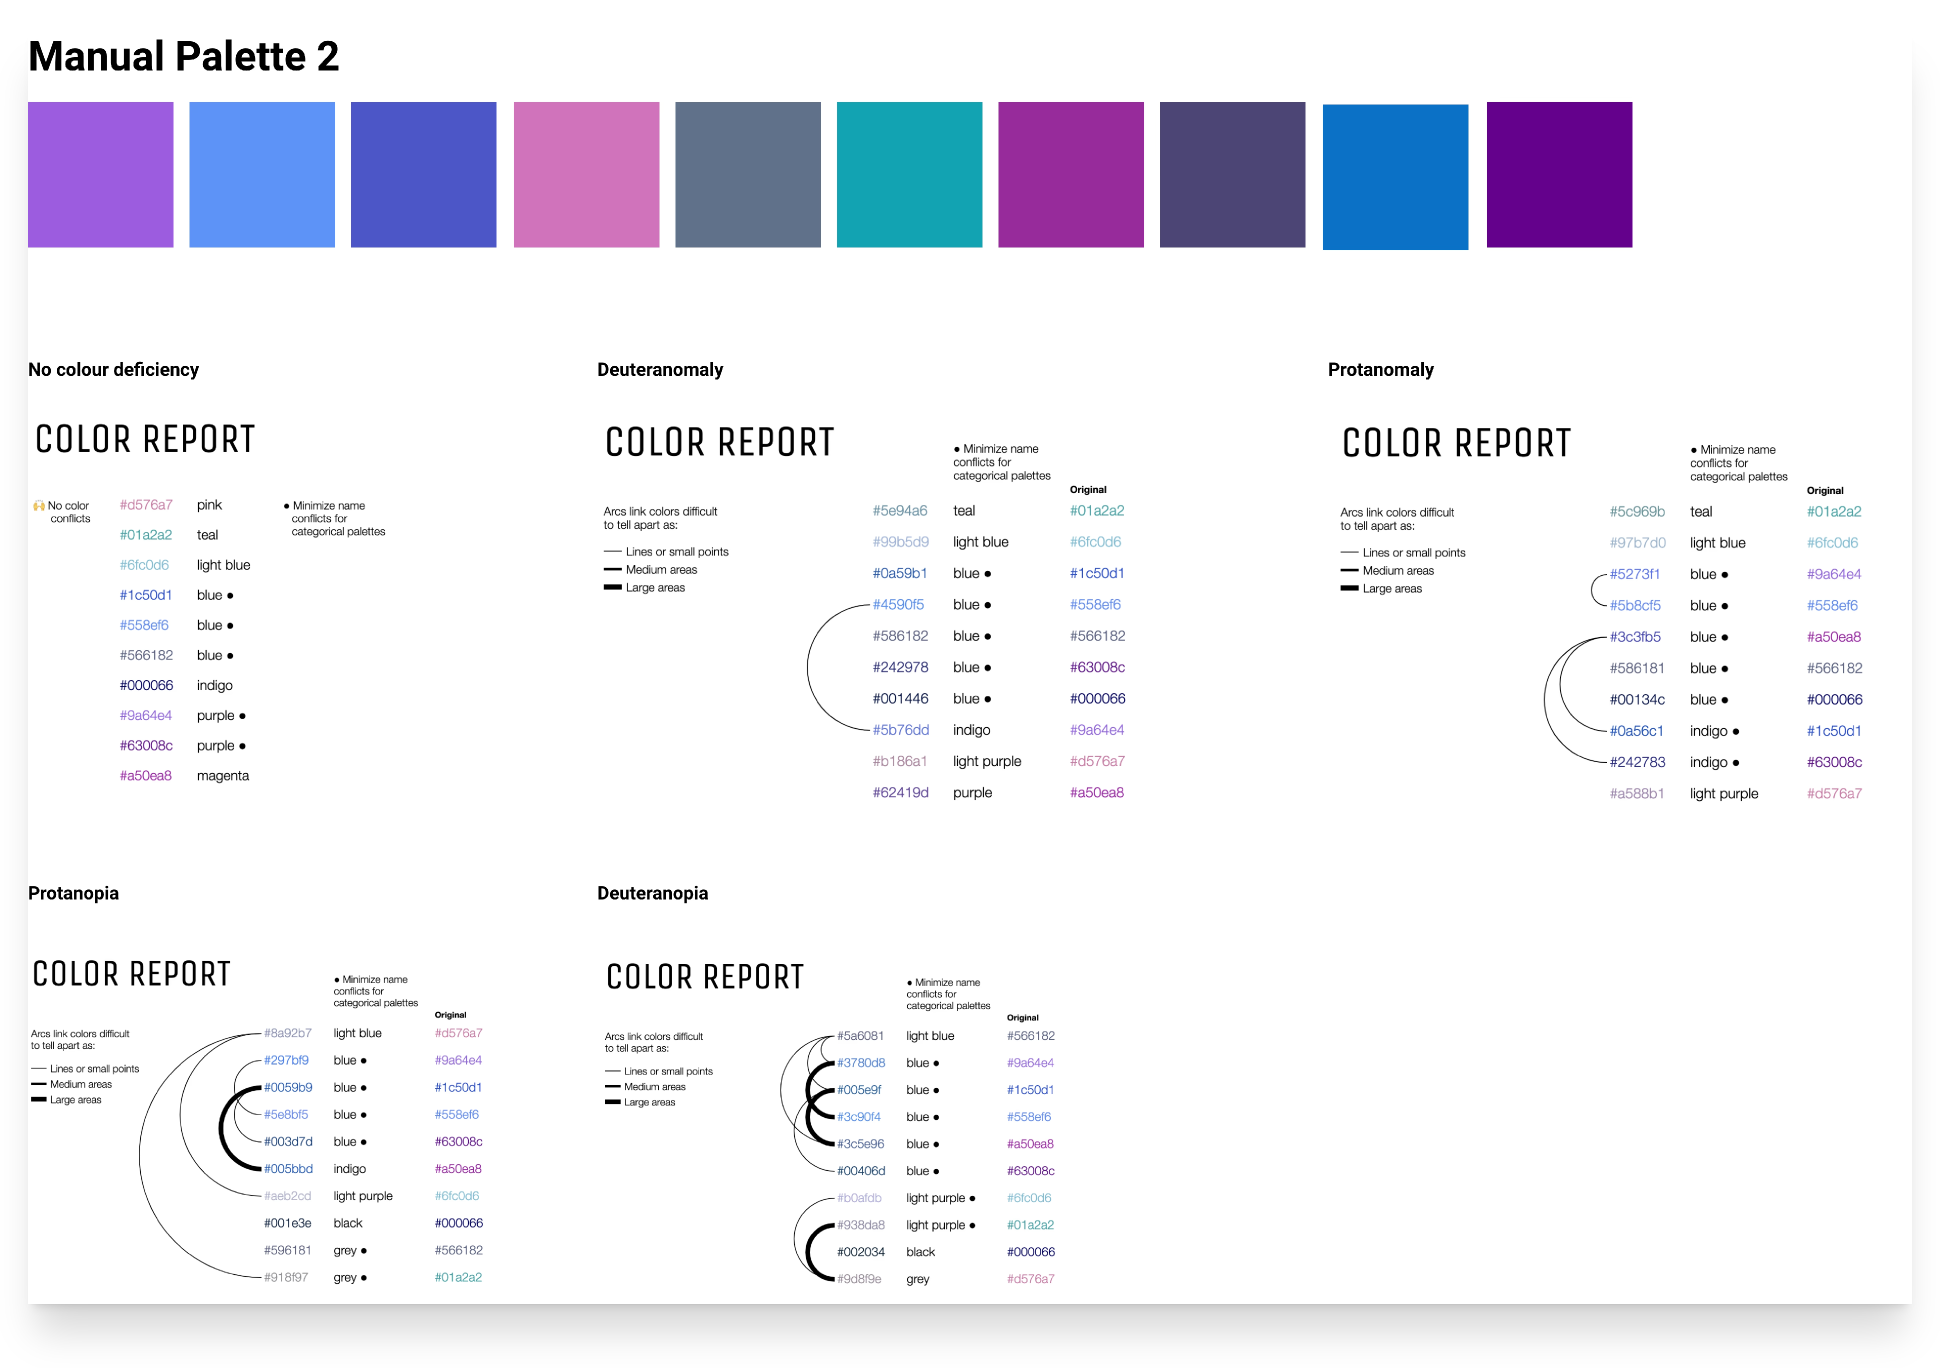
Manual Palette 2 — alternative candidate. Stronger teal-range separation but showed blue-purple collapse under Deuteranopia conditions.
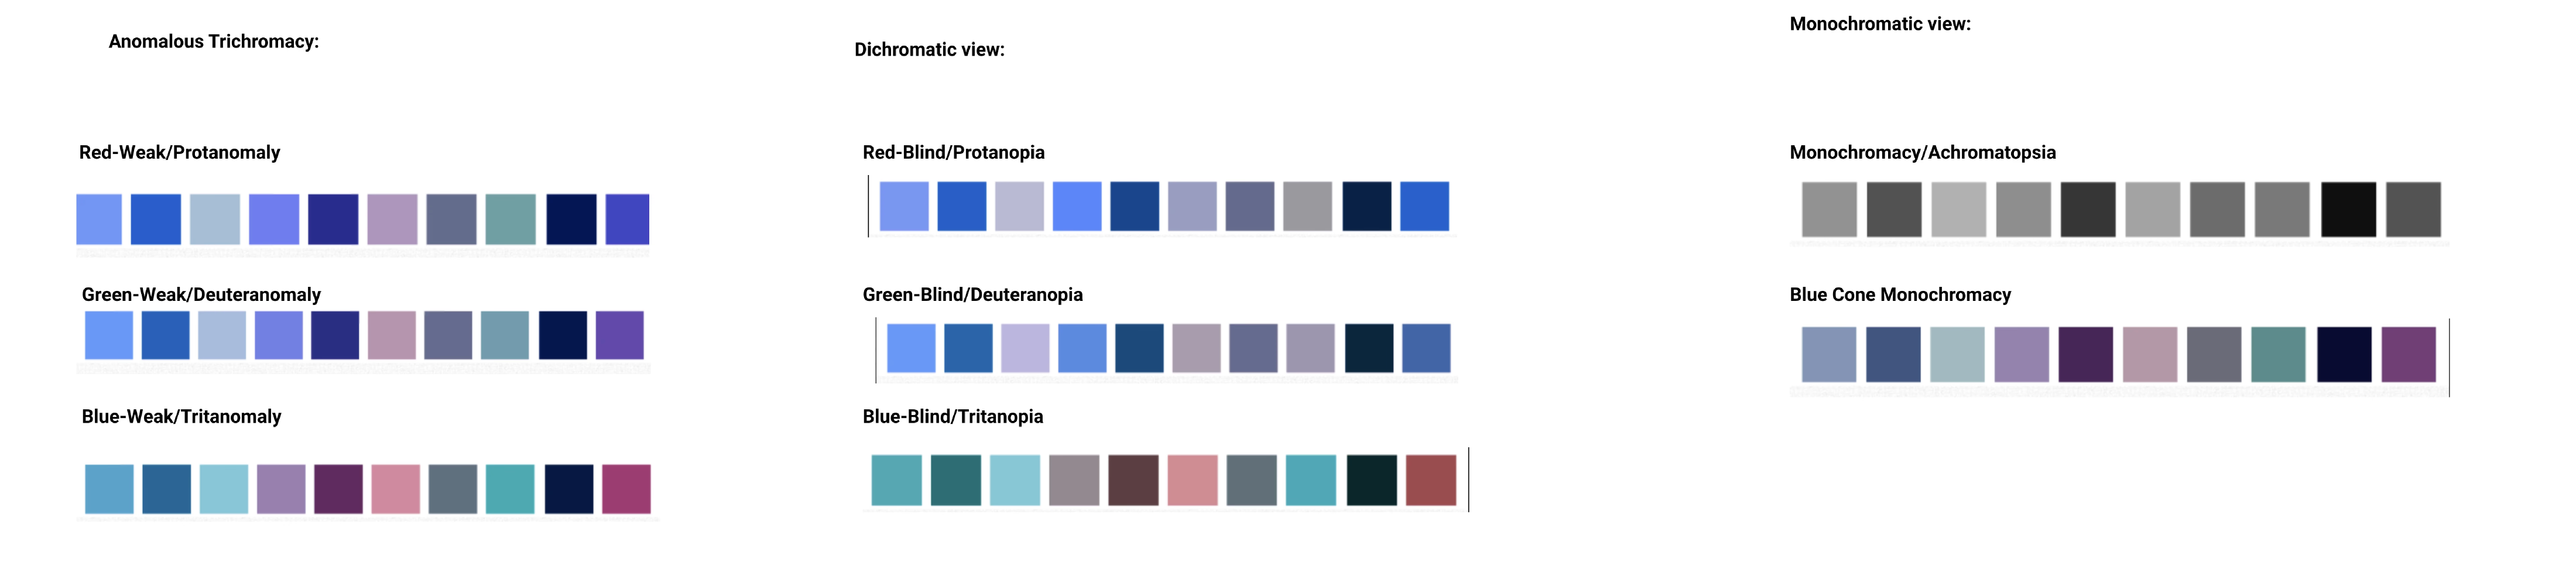
Full 8-condition CVD simulation grid — Anomalous Trichromacy, Dichromatic (Red-Blind, Green-Blind, Blue-Blind), and Monochromatic views. The final palette holds readable differentiation across all conditions.
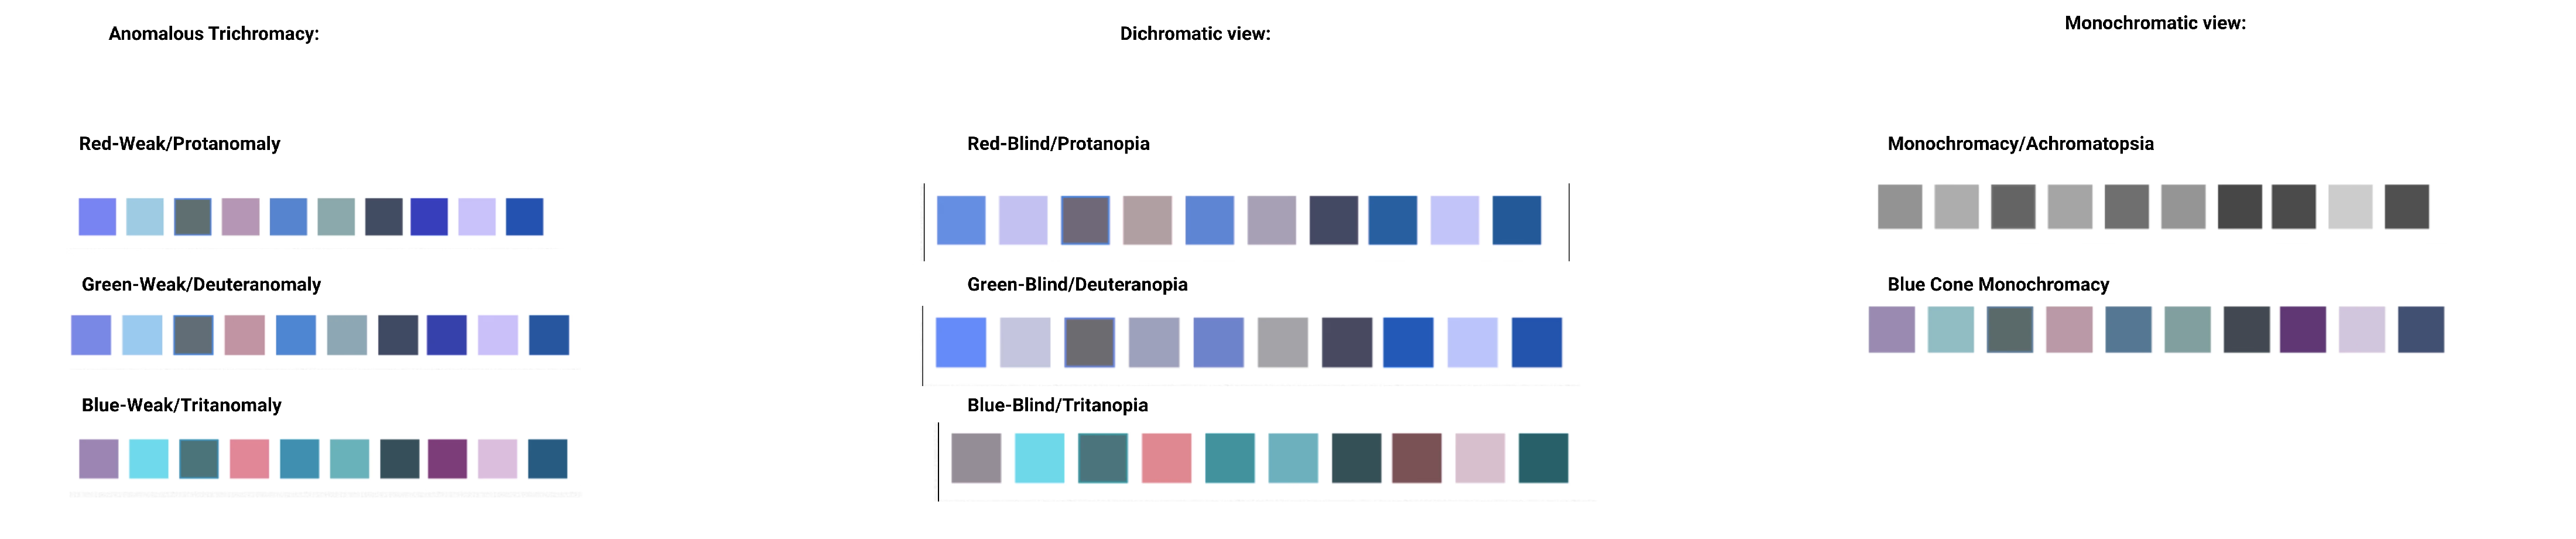
Extended CVD grid — all three deficiency categories side by side: Anomalous Trichromacy (Red/Green/Blue-Weak), Dichromatic (Red/Green/Blue-Blind), and Monochromatic. The palette retains usable hue separation across every simulated condition.
Before & After
The Transformation
Before
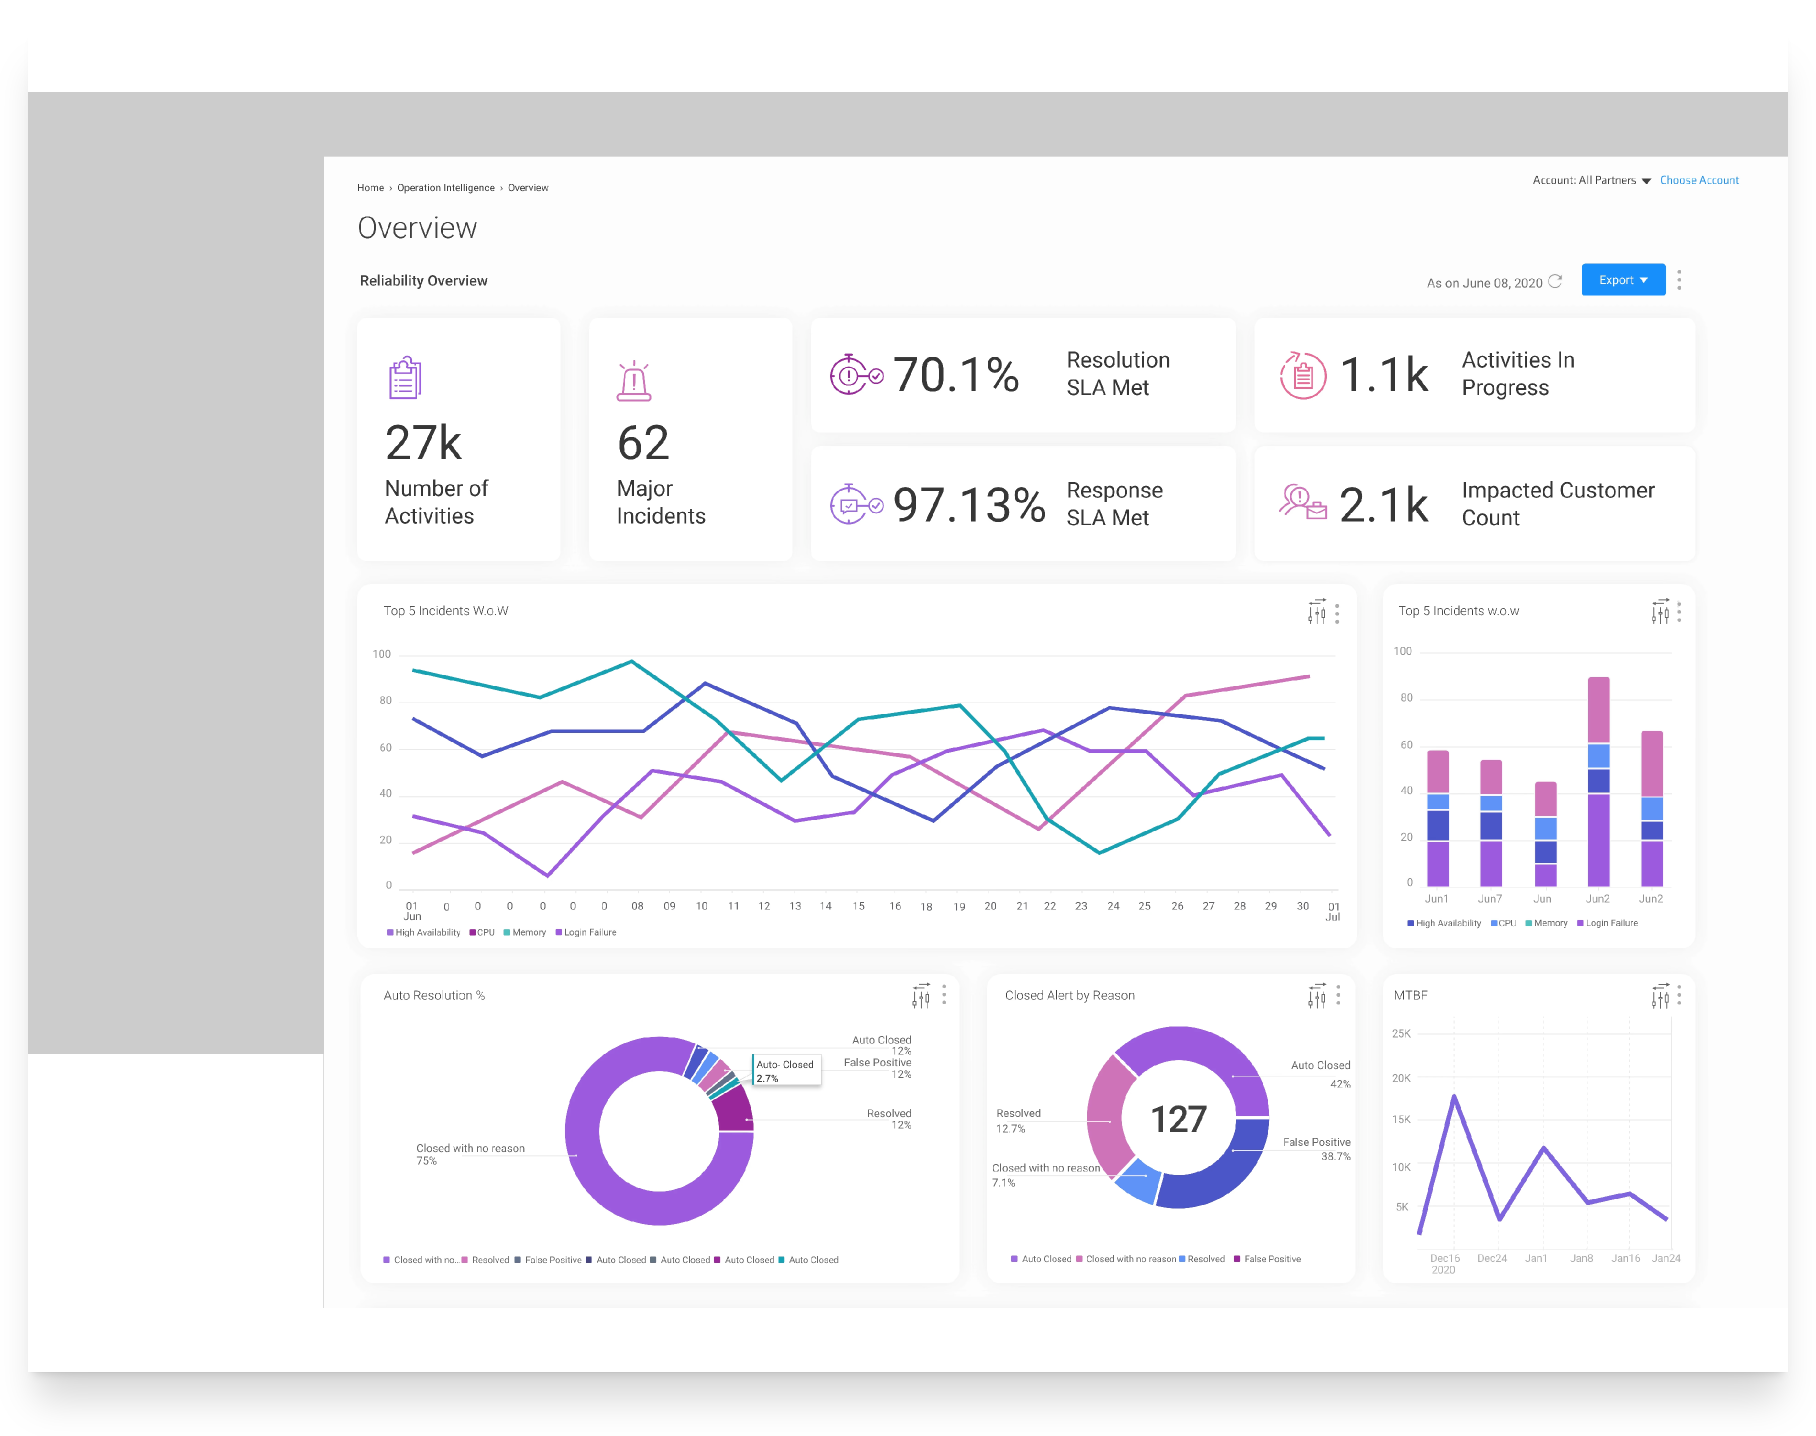
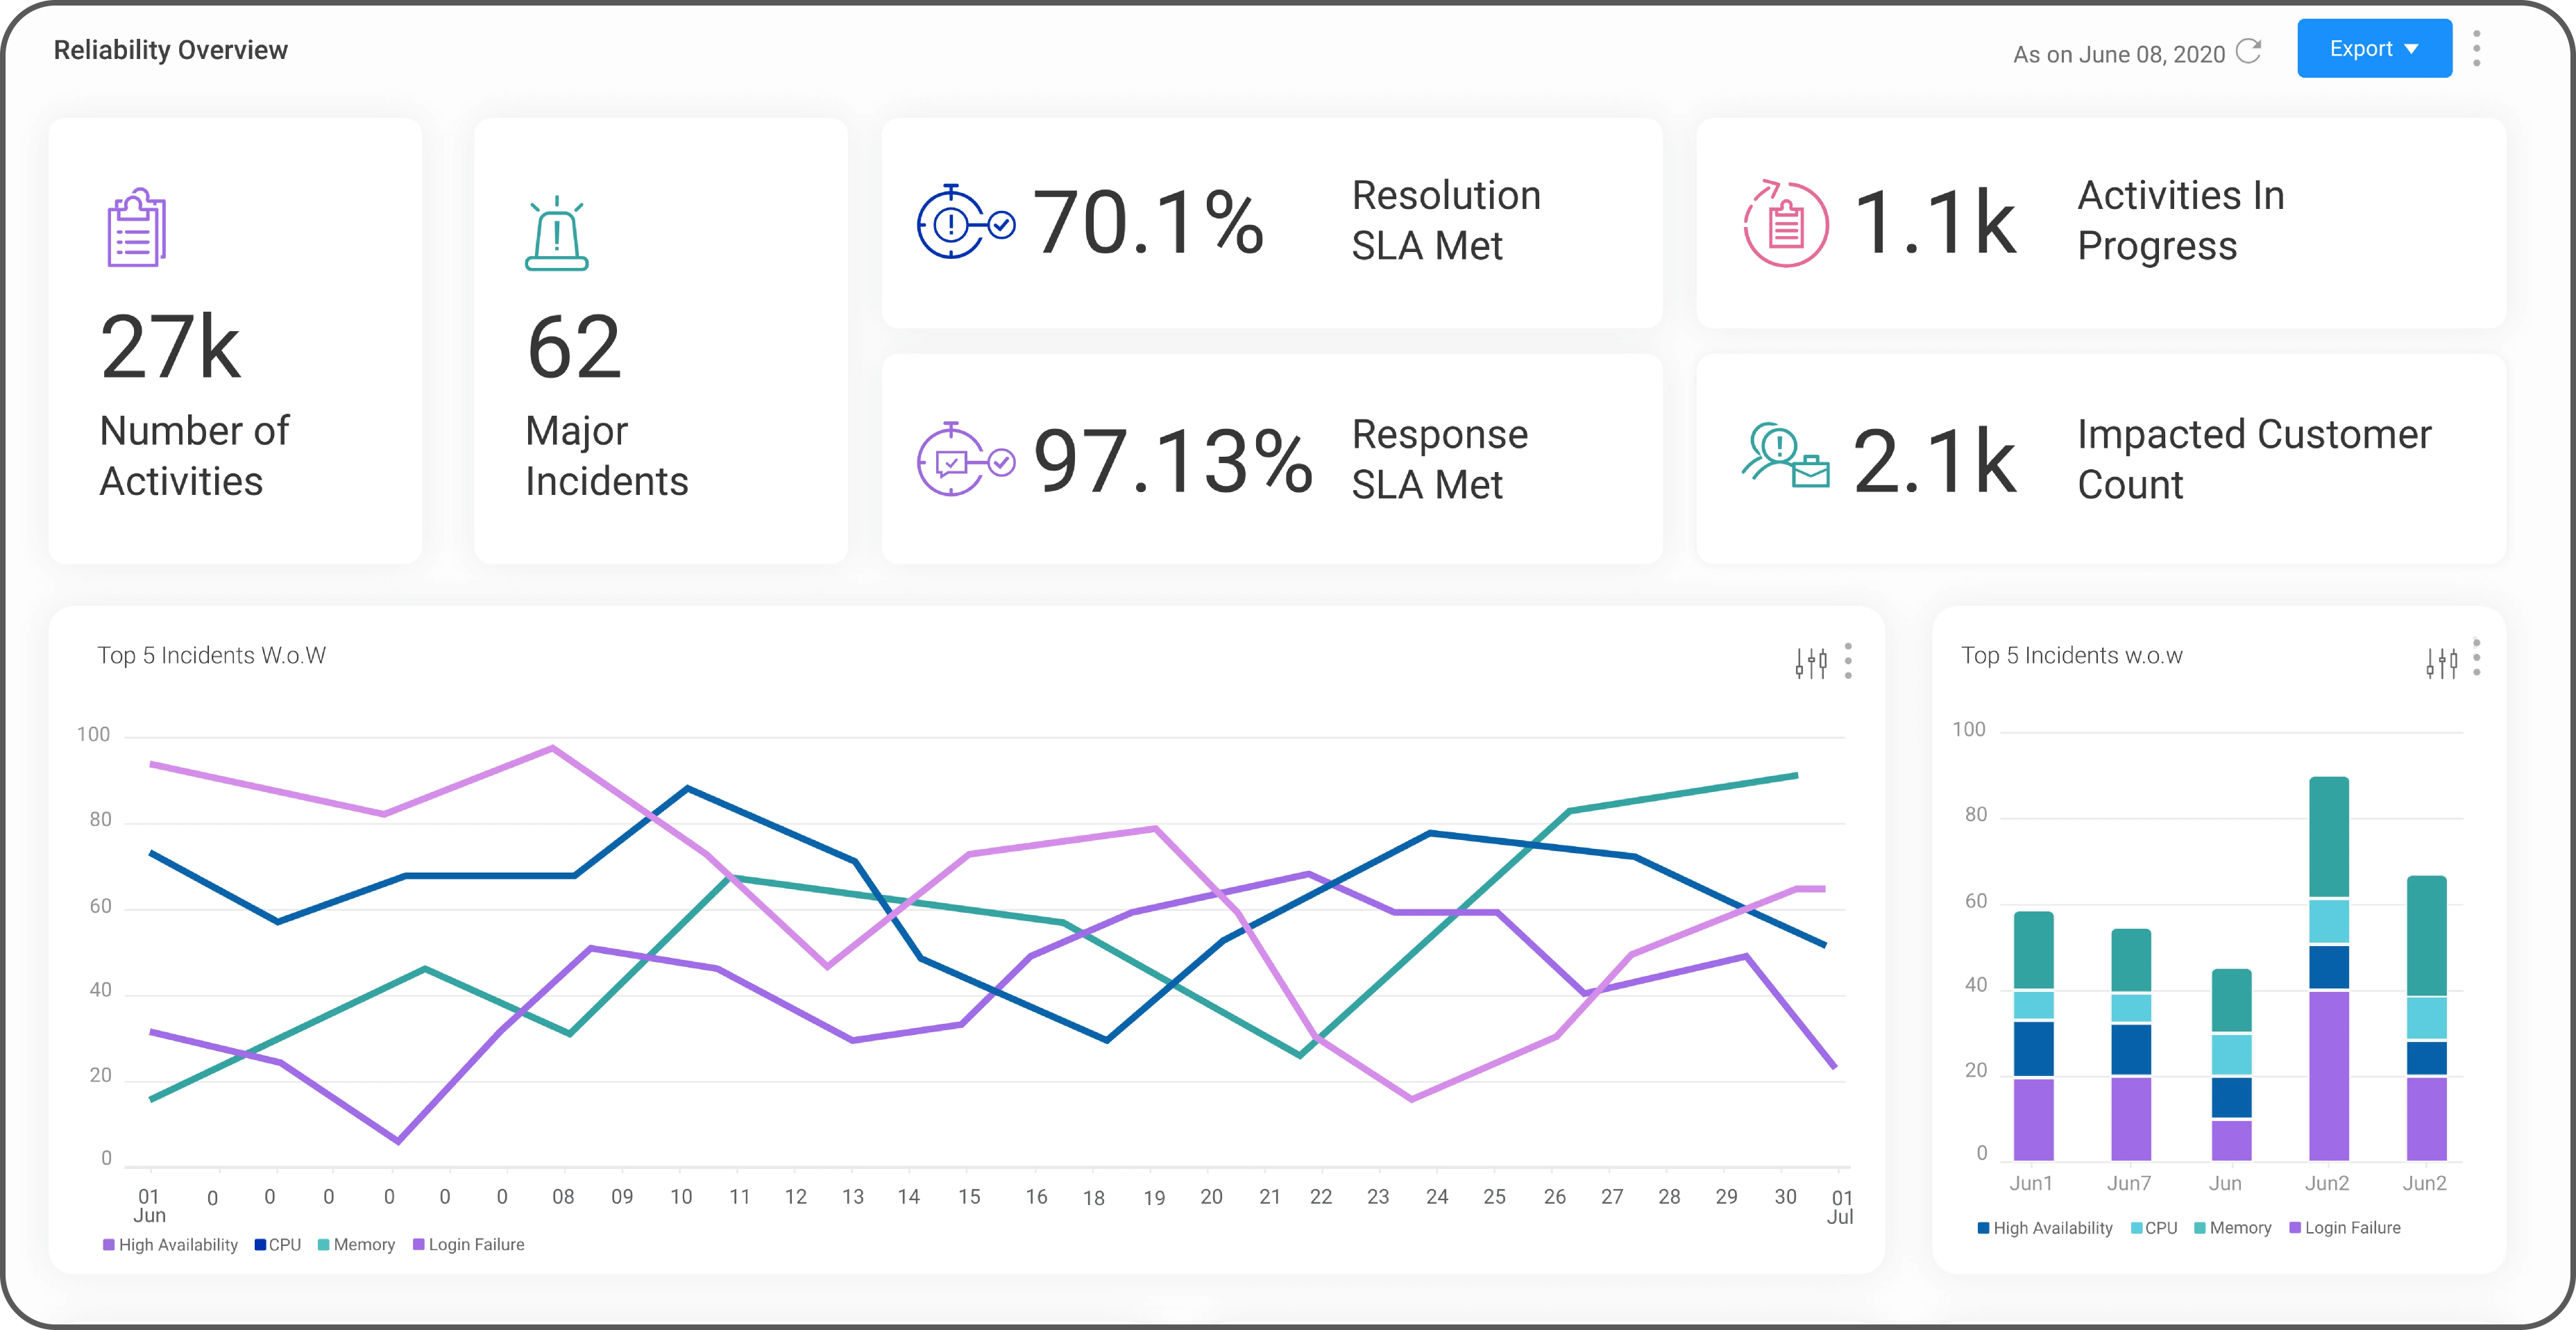
Original dashboard — overlapping hues across line, bar and donut charts. Multiple segments fail to differentiate at a glance.
After
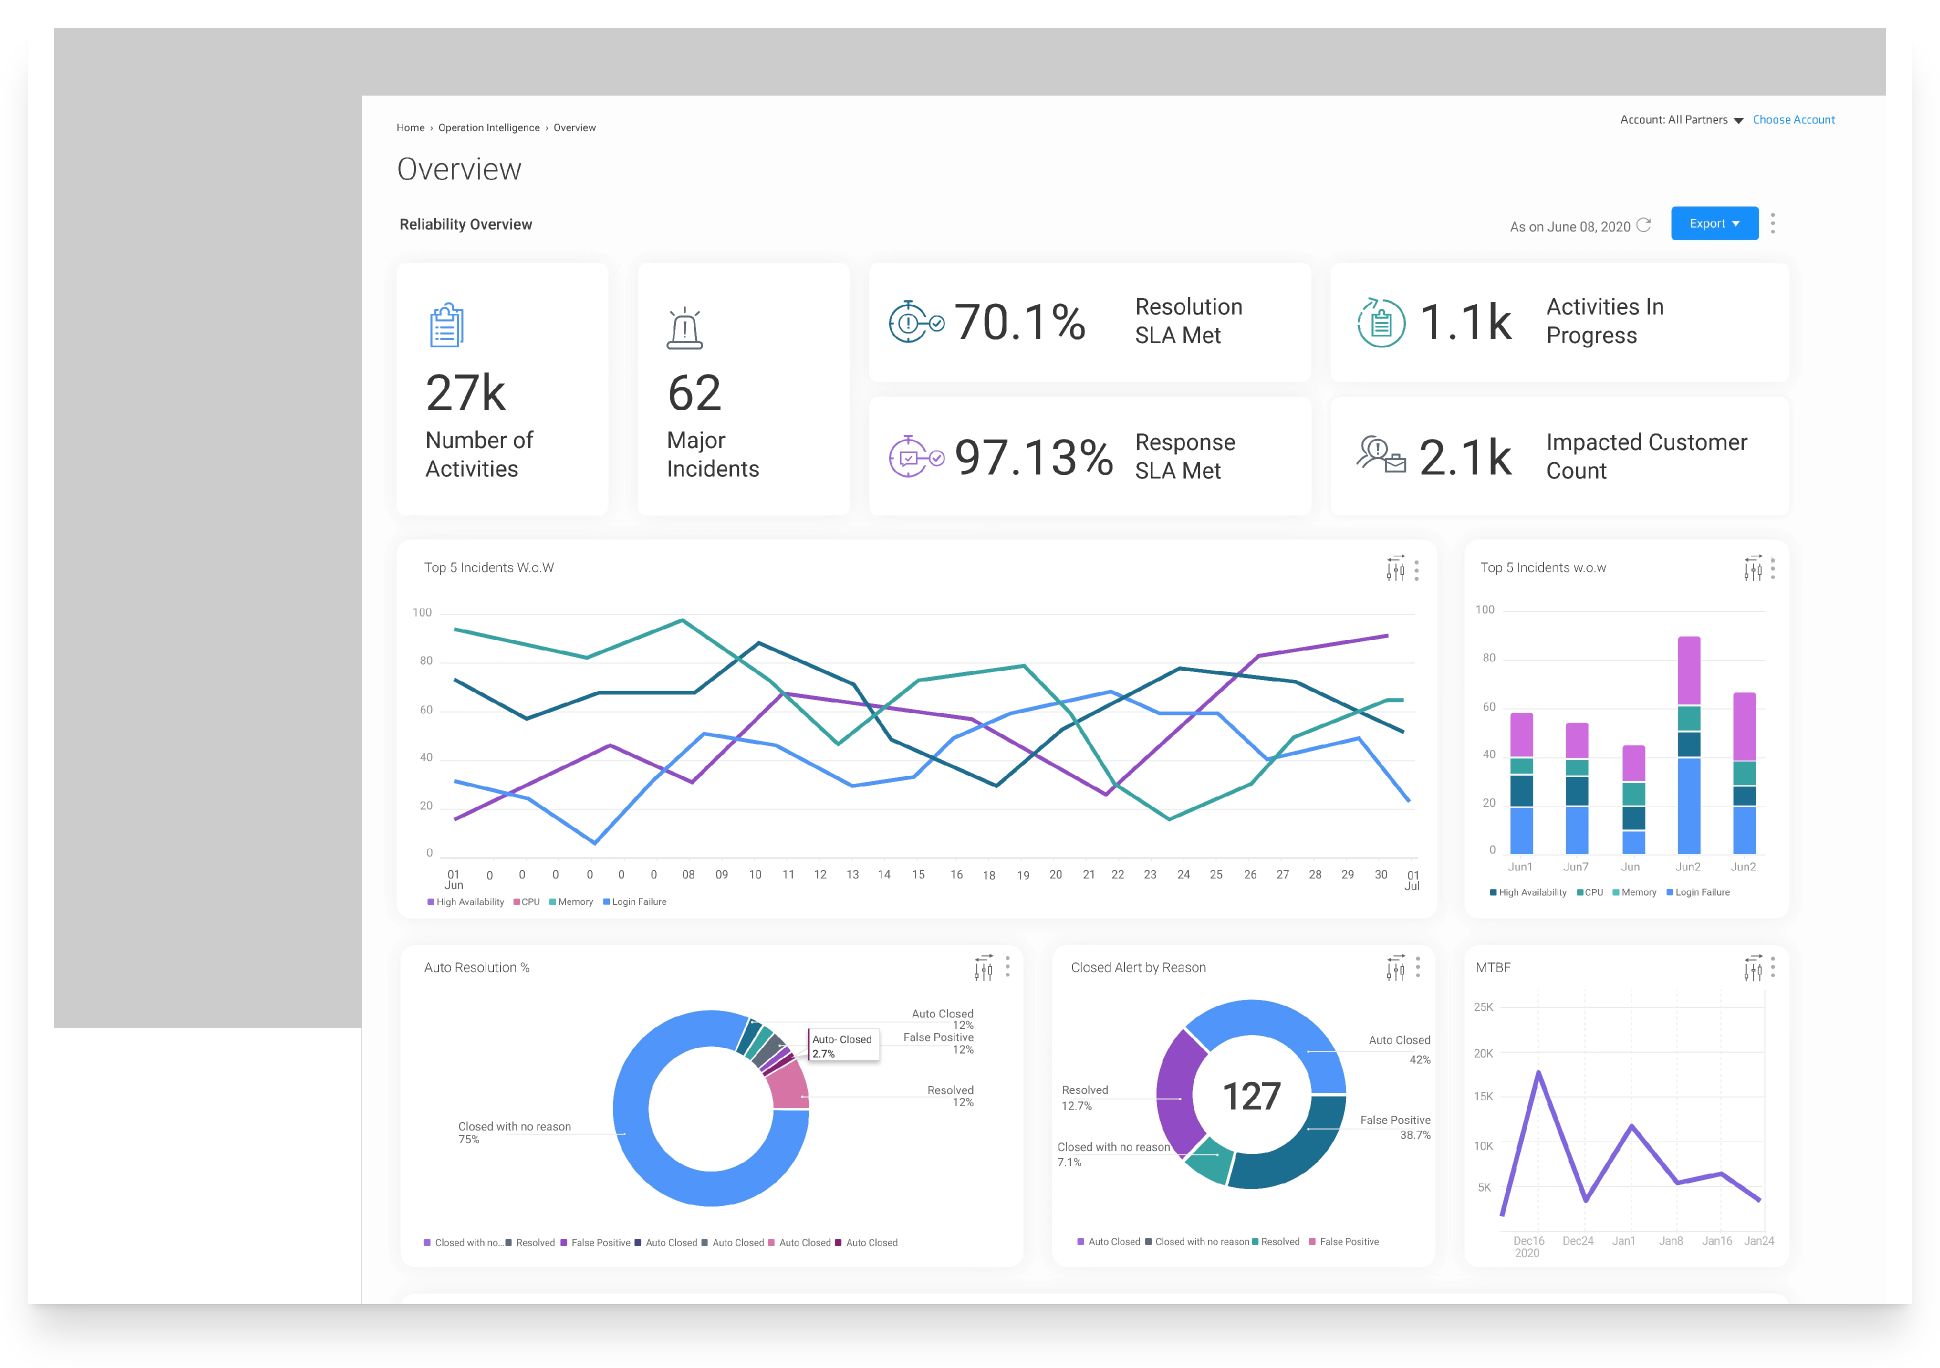
Redesigned dashboard — perceptually distinct colours with clear hue families. Every chart readable at a glance, including under CVD.
Final Palette
The Accessible Colour System
Eight carefully tested colours that maintain perceptual distinction across normal vision and the most common colour vision deficiencies.

The final deployed palette — 10 perceptually distinct colours, WCAG AA contrast compliance, and meaningful hue separation across the most common CVD conditions.
Solution
Interaction Enhancements
Beyond the palette, we introduced several interaction-level improvements to make charts more accessible and data more actionable.
- Background: light gray → white for stronger base contrast.
- Whitespace dividers between adjacent bars/slices/lines to aid separation.
- Raw data (CSV) export for machine-readable access.
- View as data table for screen-reader-friendly navigation.
- Text descriptions via info icons (per widget & overall dashboard context).

Whitespace dividers between adjacent bars/slices/lines to aid separation.
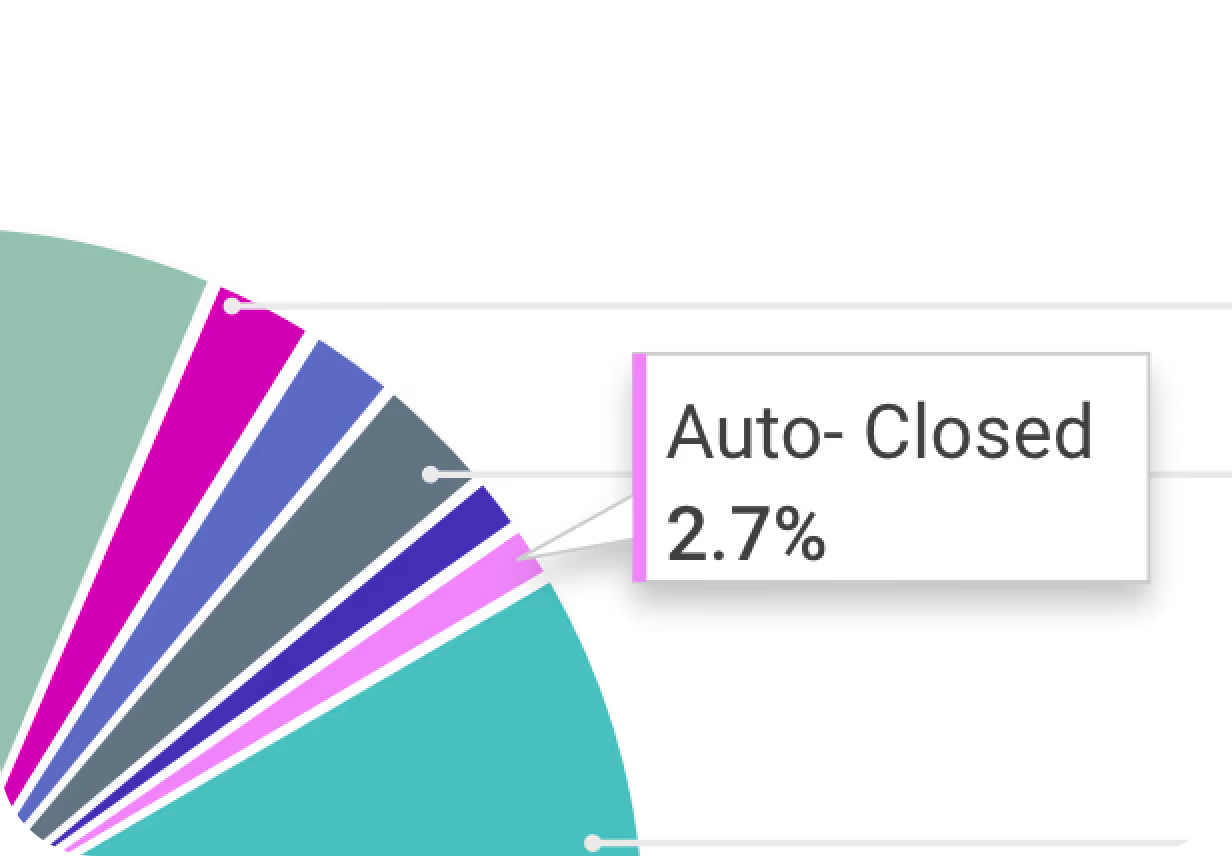
On hover tool tips with color indicators to identify the value easily.
Design Decision
Warm Palette vs. Neutral Palette — The Call That Wasn't Obvious
The CVD analysis pointed to a technically valid neutral palette: desaturated mid-tones with consistent hue spacing, no warm bias. The contrast ratios were solid. The CVD simulations passed.
I chose the warmer palette instead. Here's the reasoning:
CONSIDERED — Neutral palette
Technically correct. CVD-safe. Consistent contrast. But in A/B testing, analysts described it as "clinical," "cold," and "harder to read after an hour." Long-shift use exposed what the CVD audit couldn't measure: fatigue.
CHOSEN — Warm palette
Analysts used the words "easier to scan" and "less noise" without prompting. The warmth reduced perceived visual fatigue on 8-hour shifts. CVD performance held across Deuteranomaly and Protanomaly — the two most prevalent types. The palette is less strictly neutral, but more usable in the real environment analysts work in.
The lesson: a palette optimised for a simulation booth and a palette optimised for an 8-hour analyst shift are not the same thing. The right answer came from watching people use the system under realistic conditions, not from the audit spreadsheet alone.
Validation
A/B Testing with Real Users
We ran A/B tests across two analyst cohorts — one using the legacy grey palette, one using our new warm, high-contrast palette — across a two-week period of live dashboard use.
Key Test Results
- Analysts consistently preferred the warmer palette — citing readability and reduced eye fatigue during 8-hour shifts. The cooler, more neutral alternatives tested lower on perceived clarity.
- Misread rate dropped — instances where analysts misidentified which chart segment corresponded to which category were significantly reduced with the new whitespace-gap treatment.
- CVD users (3 participants) reported no change in usability — confirming the palette holds across the most common deficiency types (Deuteranomaly, Protanomaly) without degrading for standard-vision users.
- Preference was not just aesthetic — analysts used the phrase "easier to scan" and "less noise" unprompted, aligning with the JND and contrast intent of the redesign.
Impact
Results & Outcomes
4x
Perceived value of dashboard visuals
100% AA
WCAG compliance across all charts
+30%
User satisfaction increase
My Learnings
- Reframing the problem unlocked the real opportunity. What started as "update colours" became a full accessibility and interaction design initiative — because the right question wasn't "which colours?" but "how do users read this data?"
- Algorithmic tools got us 70% there; the last 30% was manual craft. Coblis, Viz Palette, and Adobe Color accelerated exploration, but real dashboard data and analyst feedback shaped the final choices.
- CVD simulations revealed edge cases we'd never considered. Testing against eight colour vision deficiency types exposed failures invisible to the team — especially Tritanopia and Achromatopsia.
- A/B testing with real users validated the warmer palette choice. Analysts consistently preferred the warmer, higher-contrast palette over the cooler alternatives — citing readability and reduced eye fatigue during long shifts.